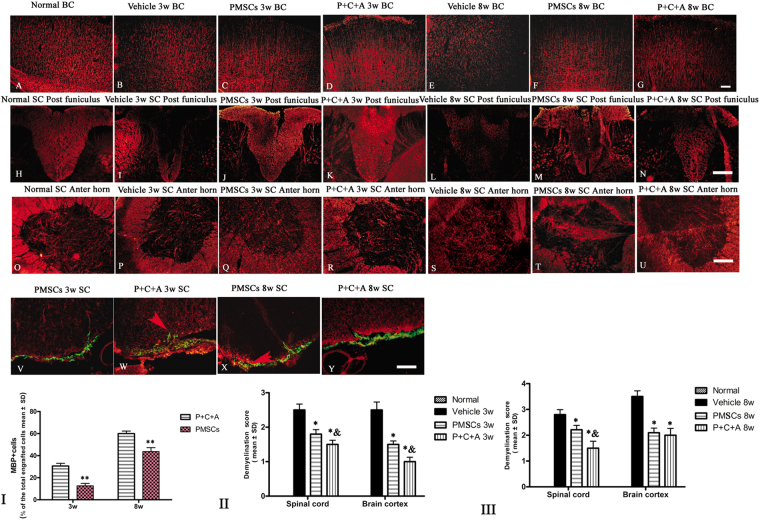
Figure 6.
Intravenous C16 and Ang-1 enhanced the efficacy of PMSC therapy for inhibiting demyelination in the EAE rat model. (A–U) Immunofluorescence staining of brain cortex and spinal cord specimens for MBP (red) at 3 and 8 weeks pi. SC denotes transverse sections through the anterior horn of the lumbar spine, and BC denotes coronal sections of the motor cortex. (V–Y) Immunofluorescence staining of PMSC grafts (green) for MBP (red) at 3 and 8 weeks pi. Arrows indicate PMSC homing to the parenchyma. Scale bar = 100 μm. (I) Percentage of MBP+ cells in all engrafted PMSCs at 3 and 8 weeks pi. n = 5, **P < 0.01 vs. P + C + A (at 3 weeks pi, ES = 1.69, P < 0.0001; at 8 weeks pi, ES = 0.92, P < 0.0001). (II,III) Demyelination scores in BC and SC at 3 (II) and 8 (III) weeks pi. n = 5, *P < 0.01 vs. vehicle, &P < 0.05 vs. PMSCs. (II) In SC, PMSCs vs. vehicle: ES = 15.41, P < 0.0001; P + C + A vs. vehicle: E = 22.93, P < 0.0001; P + C + A vs. PMSCs: ES = 9.86, P = 0.0025. In BC, PMSCs vs. vehicle: ES = 15.96, P < 0.0001; P + C + A vs. vehicle: ES = 21.51, P < 0.0001; P + C + A vs. PMSCs: ES = 17.23, P = 0.0001. (III) In SC, PMSCs vs. vehicle: ES = 9.28, P = 0.0004; P + C + A vs. vehicle: ES = 11.99, P < 0.0001; P + C + A vs. PMSCs: ES = 7.05, P = 0.005. In BC, PMSCs vs. vehicle: ES = 17.39, P < 0.0001; P + C + A vs. vehicle: ES = 12.48, P < 0.0001; P + C + A vs. PMSCs: ES = 0.95, P = 0.26.

