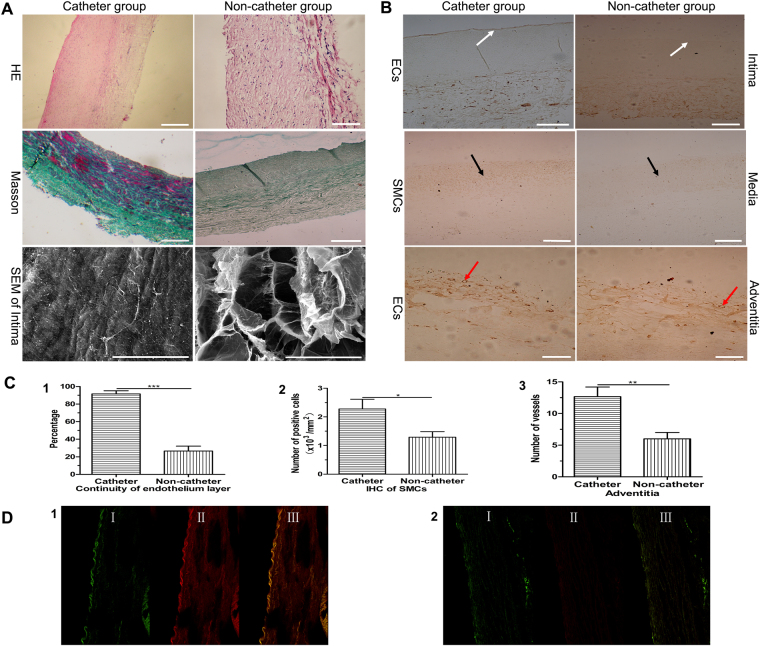
Figure 4.
Regeneration of TE artery in CG and NCG. (A) H&E (bar: 200 μm), Masson’s trichrome (bar: 200 μm) and Intima of TE artery (SEM, bar: 50 μm in CG, bar: 100 μm in NCG). (B) Endothelial layer, smooth muscle cell layer and vascularization within the adventitia of TE arteries (IHC, bar: 100 μm). (C) Quantification, (1) Continuity of endothelial layer, (2) Quantification of SMCs of TE artery, (3) Quantification of vessels formation in the adventitia of TE artery. (D) Colocalization of MSCs and ECs (I green indicated MSCs, II red showed ECs, III merge), (1) Intima of TE artery in CG, (2) Intima of TE artery in NCG, Endothelium (White arrow), SMC (Black arrow), blood vessels of adventitia (Red arrow).

