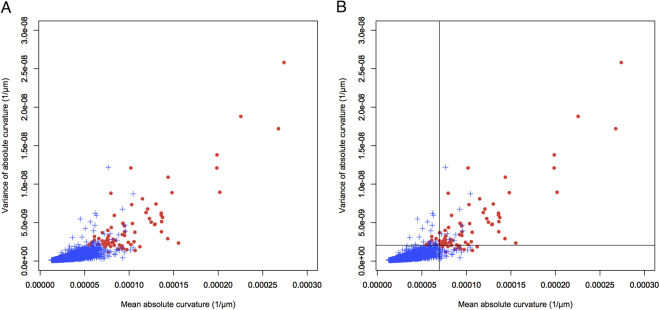
Figure 1.
Scatter plot of all 3748 eyes assigning mean absolute curvature to the horizontal axis and variance of absolute curvature to the vertical axis. (A) Seventy-seven eyes with posterior staphyloma (filled red circle) and 3671 eyes without posterior staphyloma (blue cross). (B) Splitting lines at 6.97 × 10⁻⁵ in mean absolute curvature and 2.06 × 10⁻⁹ in variance of absolute curvature were added. Most of the eyes with staphyloma localize to the upper right segment of the splitting line.

