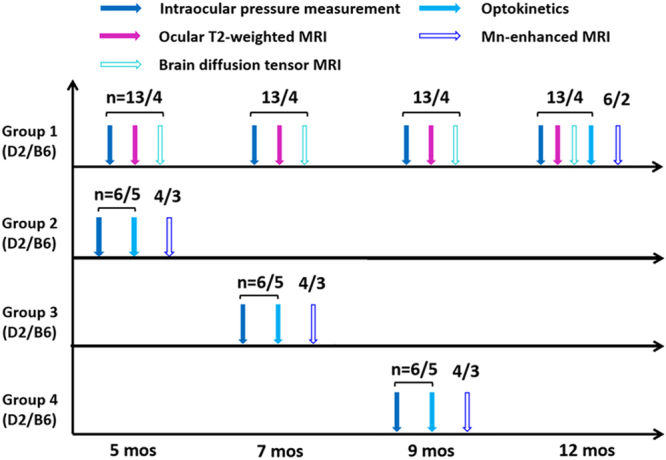
Figure 1.

Experimental outline for measuring eye, brain and behavioral changes in the D2 mouse model of chronic glaucoma and the wild type B6 mice across age. Vertical arrows on the horizontal timelines represent intraocular pressure (IOP) measurements by tonometry (solid blue), ocular anatomical T2-weighted MRI (solid purple), brain diffusion tensor MRI (DTI) (hollow cyan), visuomotor behavioral assessments by optokinetics (solid light blue), and manganese (Mn)-enhanced MRI of anterograde transport (hollow dark blue). The numbers on top of the vertical arrows represent the sample size (n) of the D2 or B6 mice for each modality at each age. In Group 1, additional IOP measurements were performed in between 7, 9 and 12 mos for more precise longitudinal monitoring of the progression of IOP elevation in the same animals (Fig. 2a).
