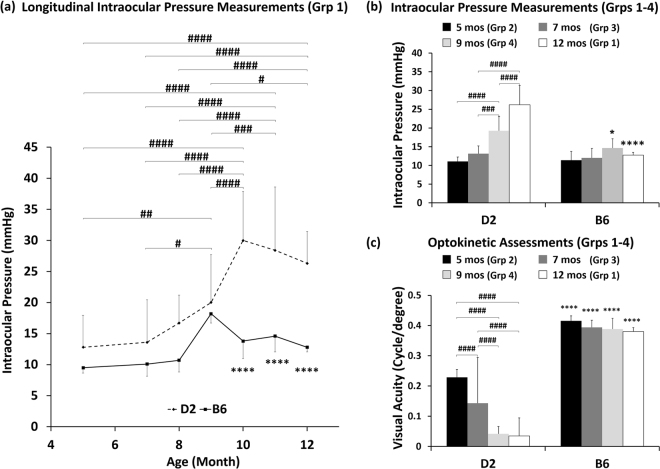
Figure 2.
Intraocular pressure (IOP) measurements and optokinetic assessments of D2 and B6 mice across age. (a) IOP profiles of the D2 (dashed line) and B6 (solid line) mice in Group 1 from 5 to 12 mos. (b) IOP profiles in Groups 1–4 at 5, 7, 9 and 12 mos respectively. (c) Visual acuity of the D2 and B6 mice at 5 to 12 mos via optokinetic visuomotor behavioral assessments. Post-hoc Tukey’s tests between ages in the D2 mice: #p < 0.05, ##p < 0.01, ###p < 0.001, ####p < 0.0001; between D2 and B6 mice: *p < 0.05; ****p < 0.0001. No significant difference was observed between ages in the B6 mice. Error bars represent ± standard deviation.

