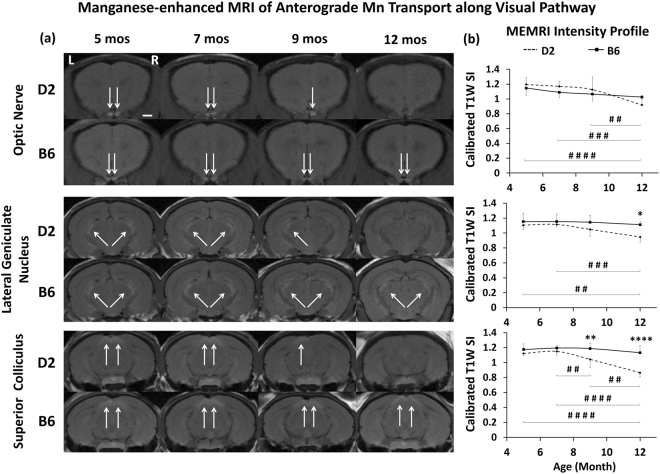
Figure 6.
Manganese (Mn)-enhanced MRI of anterograde Mn transport along the visual pathway of D2 and B6 mice in Groups 1–4 across age. (a) Mn-enhanced MRI of the optic nerve (top 2 rows), lateral geniculate nucleus (middle 2 rows) and superior colliculus (bottom 2 rows) at 8 hours after intravitreal MnCl2 injection into both eyes at 5, 7, 9 and 12 mos. White arrows indicated Mn enhancements. Scale bar = 1 mm. (b) Spatiotemporal T1-weighted (T1W) signal intensity (SI) profiles in the optic nerve (top), lateral geniculate nucleus (middle) and superior colliculus (bottom) of the D2 and B6 mice across age. T1W SI was calibrated to a nearby saline phantom to account for potential system instability between Mn-enhanced MRI experiments. Post–hoc Tukey’s tests between ages in D2: #p < 0.05, ##p < 0.01, ###p < 0.001, ####p < 0.0001; between D2 and B6: *p < 0.05, **p < 0.01, ****p < 0.0001. No significant difference was observed between ages in the B6 mice. Error bars represent ± standard deviation.

