Fig. 3.

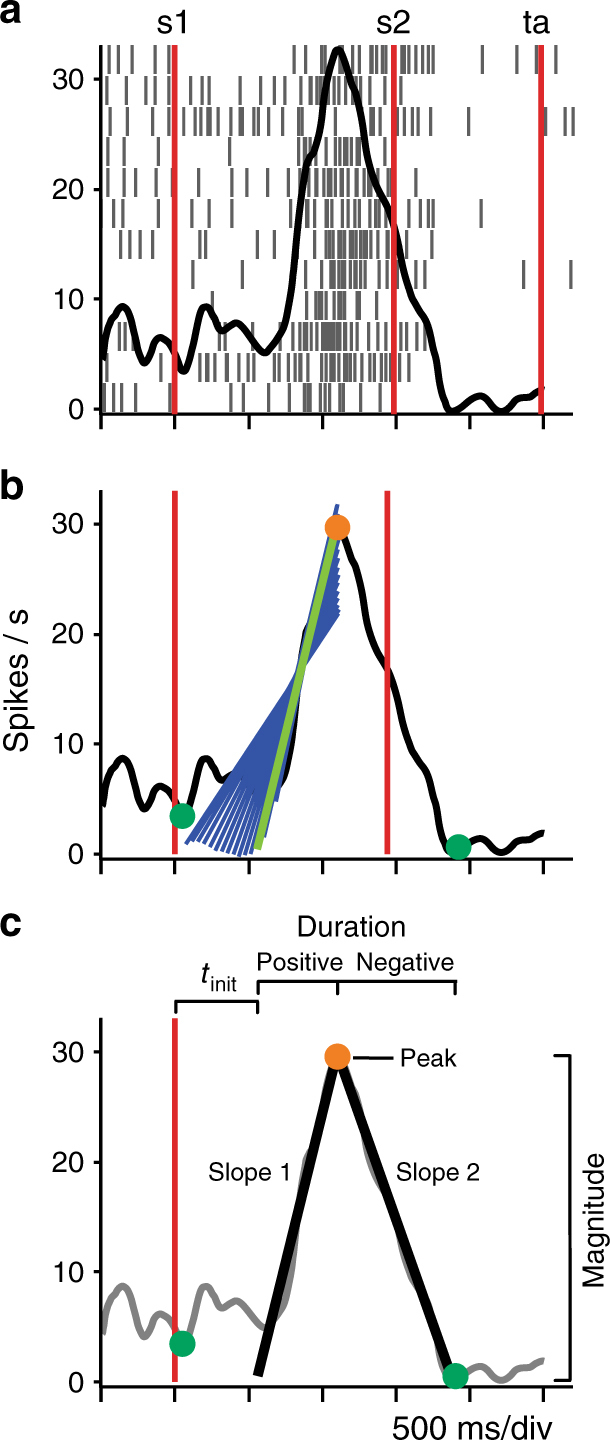
Iterative algorithm used to find the best regression model to describe the increase or decrease of instantaneous activity of boundary neurons over time with respect to a sensory event. a Raster plot and mean spikes density function (SDF; σ = 30 ms; black function) of the boundary cell in Fig. 2, for block 3 and the test interval duration of 1470 ms, aligned to the presentation of the first stimulus (s1). b A series of linear regression functions are displayed (blue lines), including the best model (thicker green line) identified by the algorithm. c Parameters extracted from the linear regression model for the identification of bisection neurons
