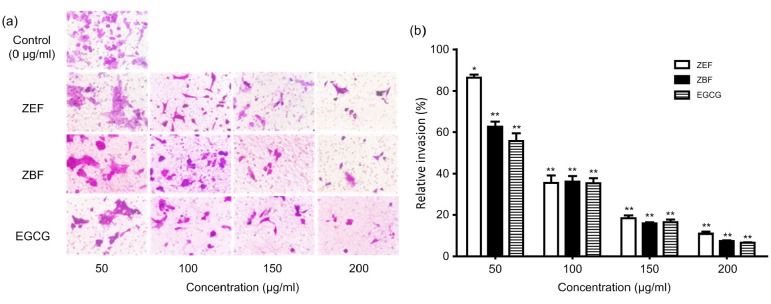
Fig. 6.
Effects of ZEF, ZBF, and EGCG on 4T1 cell migration and invasion
4T1 cells were treated with 0, 50, 100, 150, and 200 μg/ml ZEF, ZBF and EGCG for 24 h. (a) Invasion images were taken with microscopy (×400 magnification). (b) Relative invasion ratio was calculated by counting three different images of migration cell numbers. * P<0.05, ** P<0.01 as compared with control (0 μg/ml). Data are expressed as mean±SD (n=3)

