Abstract
This study was to investigate the diagnostic value of the computed tomography (CT) histogram in thyroid benign solitary coarse calcification nodules (BSCNs). A total of 89 thyroid solitary coarse calcification nodules (coarse calcification ≥5 mm, no definite soft tissue around calcification) confirmed either by surgery or histopathological examination in 86 cases enrolled from January 2009 to December 2015 were evaluated. These included 56 BSCNs and 33 malignant solitary coarse calcification nodules (MSCNs). Overall, 27 cut-off values were calculated by N (4≤N≤30) times of 50 Hounsfield units (HU) in the range of 200 to 1500 HU, and each cut-off value and the differences in the corresponding area percentages in the CT histogram were recorded for BSCN and MSCN. The optimal cut-off value and the corresponding area percentage were established by receiver operating characteristic (ROC) curve analysis. In the 19 groups with an ROC area under curve (AUC) of more than 0.7, at a cut-off value of 800 HU and at an area percentage of no more than 93.8%, the ROC AUC reached the maximum of 0.79, and the accuracy, sensitivity, and specificity were 75.3%, 80.4%, and 66.7%, respectively. At a cut-off value of 1050 HU and at an area percentage of no more than 93.6%, the accuracy, sensitivity, and specificity were 71.9%, 60.7%, and 90.9%, respectively. At a cut-off of 1150 HU and area of no more than 98.4%, the accuracy, sensitivity, and specificity were 70.8%, 57.1%, and 93.9%, respectively. At a cut-off of 600 HU and area of no more than 12.1%, the accuracy, sensitivity, and specificity were 61.8%, 39.3%, and 100.0%, respectively. Compared with the cut-off value of 800 HU and an area percentage of no more than 93.8%, the sensitivity of cut-off values and minimum areas of 1050 HU and 93.6%, of 1150 HU and 98.4%, and of 600 HU and 12.1%, was gradually decreasing; however, their specificity was gradually increasing. This can provide an important basis for reducing the misdiagnosis and unnecessary surgical trauma.
Keywords: Thyroid nodule, Thyroid cancer, Coarse calcification, Computed tomography histogram
1. Introduction
Calcification is a common radiographic sign for thyroid nodules, and it is often accidentally found during ultrasonography or computed tomography (CT) of the neck as well as in chest CT or plain radiographic examination (Seiberling et al., 2004; Yoon et al., 2007; Moon et al., 2008; Lu et al., 2011; Shi et al., 2012). In ultrasonic testing, however, because of obvious echo attenuation caused by coarse calcifications and different classification methods used by different researchers for coarse calcification subtypes, there exist great differences in the conclusions regarding their diagnostic value (Kim et al., 2008; Park et al., 2009). Although fine-needle aspiration biopsy (FNAB) has been regarded as the optimal method for differentiating benign from malignant thyroid nodules (Lu et al., 2011; Wu et al., 2012; Kim et al., 2013; Lee et al., 2013; Park et al., 2014), it is hard for the fine needle to penetrate the hard, thick calcified nodules; further, even if penetration is achieved, it is difficult to obtain adequate histological specimens, rendering the diagnosis difficult (Kim et al., 2008; Park M et al., 2009; Wu et al., 2012; Park YJ et al., 2014; Yang et al., 2016).
CT examination is not restricted by echo attenuation and can fully show the size, shape, and density of the calcification, and changes of this density are very important for the differentiation between benign and malignant nodules. Holtz and Powers (1958) considered that there was a greater density of calcifications observed in benign nodules than in malignant ones. For solitary coarse calcifications of uneven density, it is hard to accurately judge the density changes using the density of one or some points.
Our early studies confirmed that calcification artifacts were more common in high-density benign solitary coarse calcifications; however, the specificity of the diagnosis of benign solitary coarse calcification nodules (BSCNs) was only 76.9% (Zhu et al., 2015), and this judgment was likely to be influenced by certain subjective factors. Therefore, it is very important to develop a method to objectively reflect the calcification degree of thyroid tumors. The CT histogram can reflect the pixel densities of all of the areas of interest. In this study, we assumed that the differences in calcification density distribution between malignant solitary coarse calcification nodule (MSCN) and BSCN may be represented by CT histograms, since the density of MSCN is often lower than that of BSCN. As far as we know, there are no reports concerning the use of CT histogram analysis for differential diagnosis of solitary coarse calcifications in thyroid nodules. This study aimed to analyze CT histograms in MSCN and BSCN and explore the diagnostic value of CT histograms in differentiating between MSCN and BSCN.
2. Materials and methods
2.1. General materials
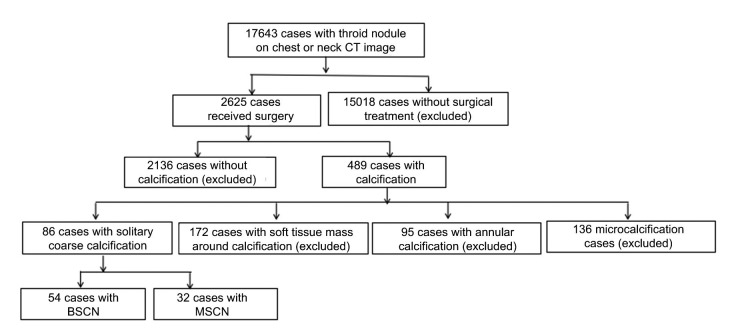
From January 2009 to December 2015, thyroid nodules were found in 17 643 patients in our hospital via CT examination of the chest or neck. Overall, 2625 patients underwent surgery and the diagnosis was confirmed by histopathological examination; the remaining 15 018 patients who received no surgical treatment were excluded from this study. Among the 2625 patients who underwent surgery, 489 cases showed calcifications on CT examination, and the 2136 cases without calcifications were subsequently excluded. In the 489 cases with calcification, 86 cases showed solitary coarse calcifications; the remaining 403 cases were excluded because of the presence of micro-calcifications, annular calcifications, or the presence of soft tissue mass around the calcification (Fig. 1). Finally, 54 cases of nodular goiter (mean patient age, (56.2±9.2) years; range, 29–76 years) and 32 cases of papillary thyroid cancer (mean patient age, (52.1±13.1) years; range, 31–73 years) met the inclusion criteria.
Fig. 1.
Flowchart of study population
2.2. Examination method
CT scans were performed with lightspeed 16 CT (Optima CT540, GE Healthcare Technologies, Boston, USA). The patients were scanned in a supine position and the range was from the pharynx oralis to the upper edge of the clavicle. The range should be consistent. The scanning parameters were as follows: 120 kV, 250 mA, 0.625 mm×16 mm of collimation, 0.938 of pitch, 0.5 s of frame rotation, 3.75 mm of cross-sectional thickness, and 3.75 mm of cross-sectional distance.
2.3. Analysis of CT feature
Using a post-processing workstation (Advantage Windows 4.6 workstation, GE, Milwaukee, WI, USA), the images were assessed by two radiologists working together: one radiologist with 10 years’ work experience and another with 15 years’ work experience. The largest level of mass in the image was chosen, the region of interest (ROI) was painted by hand and was taken to be the maximum area as far as possible, while avoiding artifacts on the edges of the lesions. A solitary coarse calcification was defined as a nodular calcification measuring ≥5 mm without a soft tissue mass around the calcification. CT histogram analysis software was used to describe CT value distribution curves for the areas of interest, with the X axis representing the CT values’ distribution scope of the areas of interest and the Y axis representing the frequency of each CT value. Overall, 27 cut-off values were calculated by N (4≤N≤30) times of 50 Hounsfield units (HU) in the range of 200 to 1500 HU. The software can acquire CT value distribution of areas of interest automatically.
2.4. Statistical analysis
All analyses were performed using SPSS 21. The Z test was applied to compare the differences in size between BSCN and MSCN, and a P-value of <0.05 was considered statistically significant. The distributions of different threshold percentages in BSCN and MSCN were analyzed by the Chi-square test, and a P-value of <0.05 was regarded as statistically significant. The sensitivities and specificities of different threshold percentages were also calculated.
3. Results
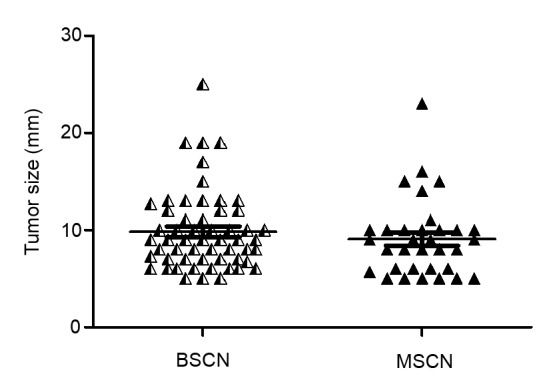
Of the 56 BSCNs from 54 cases, 22 BSCNs were located on the right lobe and 34 BSCNs were on the left. The mean diameter of the coarse calcifications was (0.99±0.41) cm (range, 0.5–2.5 cm).
Of the 33 MSCNs in 32 cases, 14 MSCNs were located on the right lobe and 19 MSCNs were on the left. The mean diameter of the coarse calcifications was (0.91±0.39) cm (range, 0.5–2.3 cm). The tumor sizes in the BSCN and MSCN cases showed no statistical differences (Fig. 2).
Fig. 2.

Distrubution of tumor sizes in the BSCN and MSCN cases
For the 27 cut-off values, there were 19 cut-off values wherein the area under the curve (AUC) of the receiver operating characteristic (ROC) was larger than 0.7; these 19 cut-off values were 350, 400, 450, 500, 550, 600, 650, 700, 750, 800, 850, 900, 950, 1000, 1050, 1100, 1150, 1200, and 1250 HU. The largest ROC AUC was 0.79 at a cut-off value of 800 HU. For the different optimal percentages at each cut-off value for the 19 groups of ROC AUC more than 0.7, there were corresponding differences in the specificity, sensitivity, and accuracy of the diagnosis of BSCN (Table 1).
Table 1.
Optimal percentage and diagnostic performance of each cut-off value for the ROC AUC more than 0.7
| Cut-off (HU) | ROC AUC | Optimal percentage (%) | Specificity (%) | Sensitivity (%) | Accuracy (%) |
| 350 | 0.748 | 1.2 | 75.8 | 66.1 | 69.7 |
| 400 | 0.778 | 8.5 | 81.8 | 66.1 | 71.9 |
| 450 | 0.779 | 4.4 | 81.8 | 66.1 | 71.9 |
| 500 | 0.754 | 20.3 | 78.8 | 66.1 | 70.8 |
| 550 | 0.781 | 23.9 | 81.8 | 62.5 | 69.7 |
| 600 | 0.786 | 68.8 | 57.6 | 85.7 | 75.3 |
| 650 | 0.774 | 53.7 | 72.7 | 69.6 | 70.8 |
| 700 | 0.780 | 68.1 | 75.8 | 71.4 | 73.0 |
| 750 | 0.771 | 93.1 | 57.6 | 83.9 | 74.2 |
| 800 | 0.791 | 93.8 | 66.7 | 80.4 | 75.3 |
| 850 | 0.781 | 95.1 | 72.7 | 76.8 | 75.3 |
| 900 | 0.777 | 99.2 | 72.7 | 75.0 | 74.2 |
| 950 | 0.729 | 90.3 | 81.8 | 60.7 | 68.5 |
| 1000 | 0.728 | 82.2 | 90.9 | 53.6 | 67.4 |
| 1050 | 0.738 | 93.6 | 90.9 | 60.7 | 71.9 |
| 1100 | 0.759 | 96.8 | 90.9 | 58.9 | 70.8 |
| 1150 | 0.758 | 98.4 | 93.9 | 57.1 | 70.8 |
| 1200 | 0.750 | 99.0 | 93.9 | 55.4 | 69.7 |
| 1250 | 0.717 | 98.2 | 93.9 | 48.2 | 65.2 |
ROC: operating characteristic; AUC: area under curve
Among the 19 groups with ROC AUC of more than 0.7, 14 cut-off values’ specificities can reach 100% (Table 2). Among them, a cut-off value of 600 HU with an area percentage of no more than 12.1%, the accuracy and sensitivity both reached the highest with 61.8% and 39.3%, respectively.
Table 2.
Optimal percentage and diagnostic performance of each cut-off value when the specificity was 100%
| Cut-off (HU) | Optimal percentage (%) | Specificity (%) | Sensitivity (%) | Accuracy (%) |
| 600 | 12.1 | 100.0 | 39.3 | 61.8 |
| 650 | 17.9 | 100.0 | 37.5 | 60.7 |
| 700 | 22.9 | 100.0 | 35.7 | 59.5 |
| 750 | 25.7 | 100.0 | 32.1 | 57.3 |
| 800 | 33.6 | 100.0 | 33.9 | 58.4 |
| 850 | 42.4 | 100.0 | 35.7 | 59.5 |
| 900 | 47.8 | 100.0 | 33.9 | 58.4 |
| 950 | 56.0 | 100.0 | 37.5 | 60.7 |
| 1000 | 56.3 | 100.0 | 30.4 | 56.2 |
| 1050 | 61.2 | 100.0 | 28.6 | 55.1 |
| 1100 | 69.6 | 100.0 | 33.9 | 58.4 |
| 1150 | 71.2 | 100.0 | 30.4 | 56.2 |
| 1200 | 83.8 | 100.0 | 33.9 | 58.4 |
| 1250 | 88.3 | 100.0 | 33.9 | 58.4 |
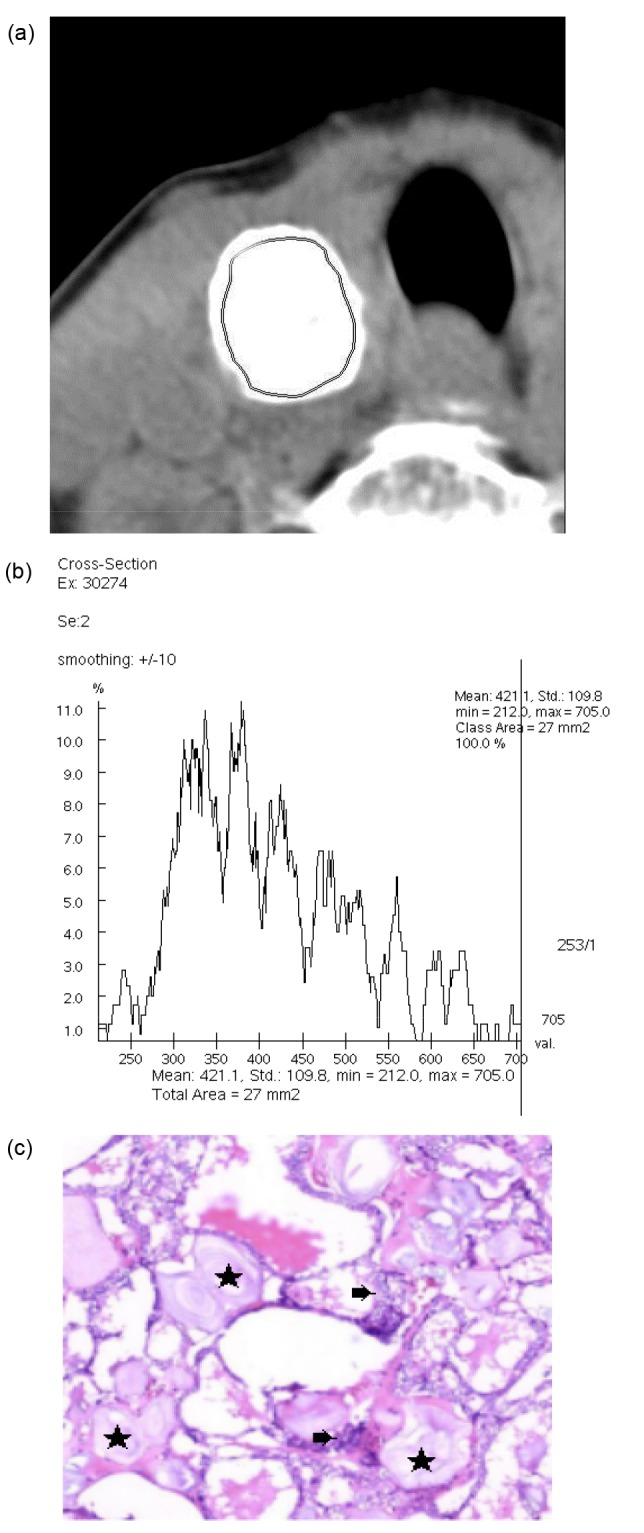
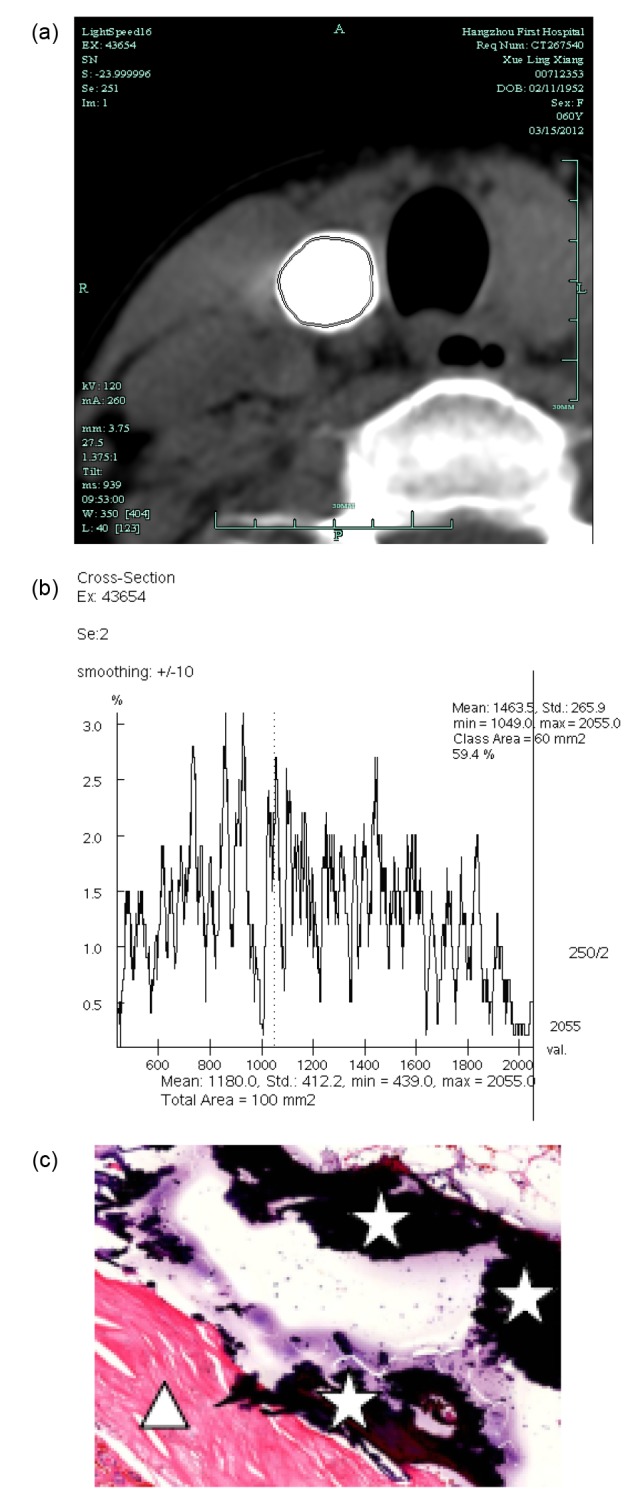
The typical CT histogram and histopathology of MSCN and BSCN are shown in Figs. 3 and 4.
Fig. 3.

CT histogram and histopathology of MSCN
(a) The region of interest (ROI) measurement area of MSCN in the right lobe of the thyroid. (b) CT histogram shows the CT value of the ROI area and its distribution percentage. The mean CT value was 421.1 HU, ranging from 212 to 705 HU. (c) Hematoxylin and eosin staining (×100 magnification): calcification (★) and cancer tissue (➡)
Fig. 4.

CT histogram and histopathology of BSCN
(a) The ROI measurement area of BSCN in the right lobe of the thyroid. (b) CT histogram shows the CT value of the ROI area and its distribution percentage. The mean CT value was 1180.0 HU, ranging from 439 to 2055 HU, and the voxel of no more than 1049 HU accounted for 40.6%. (c) Hematoxylin and eosin staining (×40 magnification): calcification (☆) and fibrillation (△)
4. Discussion
Holtz and Powers (1958) reported differences in the densities of benign and malignant calcifications in the thyroid on X-ray examinations, with the density of the former being considerably higher. This phenomenon is explained as follows: benign coarse calcifications or ossifications are more continuous, appearing as more compact slabs, blocks, strips, areas, or nodules, while malignant coarse calcifications are often discontinuous with malignant tumor cell infiltration, resulting in loose, crystalline, and dotted calcifications (Zhu et al., 2015). CT and X-ray are two different examination methods; thus, while they share the same imaging mechanisms, the density resolution on CT is significantly higher than that on plain film, suggesting that the differences in the density of calcifications in CT examination can also be used to determine the nature of the calcification.
The CT value is a much more objective method for evaluating the density of calcification. However, for solitary coarse calcification of uneven density, it is difficult to assess the density accurately based on the density of one or more points on the imaging study. In other words, the CT value cannot reflect the heterogeneity of the calcification density in the induction zone, and this results in the loss of diagnostic information. However, the CT histogram records all voxel densities and the distribution of the tumors’ areas of interest in the form of a histogram, accurately reflecting the difference in the density between each voxel. This technique was first used for the differential diagnosis of adrenal adenoma and non-adenoma by Bae et al. (2003), based on the fact that adenoma cells are rich in lipids showing negative pixels; thus, adrenal adenoma could be diagnosed by calculating the percentage of negative pixels (less than 0 HU) in the tumors. As there are certain differences in the density of calcifications between MSCN and BSCN, we assumed that the difference between MSCN and BSCN may be represented by the CT histogram; that is, when the pixel area below a certain threshold was greater than a certain value, the low-density MSCN can be differentiated from BSCN. This was proved by the results of the present study.
Among the 27 cut-off values, the ROC AUC for 19 cut-off values was greater than 0.7, indicating that these cut-off values have a certain diagnostic value for differentiating MSCN and BSCN. Further analysis showed that the specificity, sensitivity, and accuracy of the diagnosis of MSCN demonstrated considerable differences, as each cut-off value had a different optimal percentage. At a cut-off value of 800 HU and at an area percentage of no more than 93.8%, there was a relatively high accuracy and sensitivity of 75.3% and 80.4%, respectively; however, the specificity was merely 66.7%, which means that 33.3% MSCN cases would be misdiagnosed as BSCN if the CT histogram analysis was used for diagnosis. Comparing the following cut-off values and maximum area percentages of 1050 HU and 93.6%, and 1150 HU and 98.4% with 800 HU and 93.8%, the accuracy and sensitivity were both decreasing with 71.9% and 60.7%, and 70.8% and 57.1%, respectively; however, the specificity increased significantly, reaching 90.9% and 93.9%, respectively. At a cut-off value of 600 HU with an area percentage of no more than 12.1%, the accuracy and sensitivity were just 61.8% and 39.3%, respectively. However, the specificity can reach 100.0%, which means that the cut-off value of 600 HU with an area percentage of no more than 12.1% has the diagnostic value for BSCN.
5. Limitations
Firstly, the cut-off values calculated by N (4≤N≤30) times of 50 HU were not necessarily the optimal values for the diagnosis of MSCN, but simple to use for our main study purposes. Secondly, the data in our study were all acquired at a voltage of 120 kV; however, the CT histogram results may be different in different machines and with different voltages; our aim is to bring the subject to other scholars’ attention. Furthermore, all cases of MSCN were cases of papillary thyroid cancer, while all cases of BSCN consisted of cases of nodular goiter; as a consequence, whether CT histogram analysis is applicable for the diagnosis of other benign and malignant thyroid nodules remains unclear. Nevertheless, nodular goiter and papillary thyroid cancer are the most common benign and malignant thyroid lesions, respectively (Moon et al., 2009; Hoang et al., 2013), which are relatively representative. Finally, this study was retrospective research, in which selection bias may be inevitable.
In conclusion, although CT histogram analysis cannot differentiate all BSCNs from MSCNs, it remains an ideal examination method for solitary coarse calcification nodules with dramatic attenuation of ultrasound, thereby decreasing unnecessary surgery trauma and hospitalization costs.
Footnotes
Compliance with ethics guidelines: Le-xing ZHANG, Jing-jing XIANG, Pei-ying WEI, Jin-wang DING, Ding-cun LUO, Zhi-yi PENG, and Zhi-jiang HAN declare that they have no conflict of interest.
All procedures followed were in accordance with the ethical standards of the responsible committee on human experimentation (institutional and national) and with the Helsinki Declaration of 1975, as revised in 2008 (5). Informed consent was obtained from all patients for being included in the study. Additional informed consent was obtained from all patients for whom identifying information is included in this article.
References
- 1.Bae KT, Fuangtharnthip P, Prasad SR, et al. Adrenal masses: CT characterization with histogram analysis method. Radiology. 2003;228(3):735–742. doi: 10.1148/radiol.2283020878. [DOI] [PubMed] [Google Scholar]
- 2.Hoang JK, Branstetter BF, Gafton AR, et al. Imaging of thyroid carcinoma with CT and MRI: approaches to common scenarios. Cancer Imaging. 2013;13(1):128–139. doi: 10.1102/1470-7330.2013.0013. [DOI] [PMC free article] [PubMed] [Google Scholar]
- 3.Holtz S, Powers WE. Calcification in papillary carcinoma of the thyroid. Am J Roentgenol Radium Ther Nucl Med. 1958;80(6):997–1000. [PubMed] [Google Scholar]
- 4.Kim BK, Choi YS, Kwon HJ, et al. Relationship between patterns of calcification in thyroid nodules and histopathologic findings. Endocr J. 2013;60(2):155–160. doi: 10.1507/endocrj.EJ12-0294. [DOI] [PubMed] [Google Scholar]
- 5.Kim BM, Kim MJ, Kim EK, et al. Sonographic differentiation of thyroid nodules with eggshell calcifications. J Ultrasound Med. 2008;27(10):1425–1430. doi: 10.7863/jum.2008.27.10.1425. [DOI] [PubMed] [Google Scholar]
- 6.Lee J, Lee SY, Cha SH, et al. Fine-needle aspiration of thyroid nodules with macrocalcification. Thyroid. 2013;23(9):1106–1112. doi: 10.1089/thy.2012.0406. [DOI] [PubMed] [Google Scholar]
- 7.Lu Z, Mu Y, Zhu H, et al. Clinical value of using ultrasound to assess calcification patterns in thyroid nodules. World J Surg. 2011;35(1):122–127. doi: 10.1007/s00268-010-0827-3. [DOI] [PubMed] [Google Scholar]
- 8.Moon WJ, Jung SL, Lee JH, et al. Benign and malignant thyroidnodules: US differentiation-multicenter retrospective study. Radiology. 2008;247(3):762–770. doi: 10.1148/radiol.2473070944. [DOI] [PubMed] [Google Scholar]
- 9.Moon WJ, Kwag HJ, Na DG. Are there any specific ultrasound findings of nodular hyperplasia (“leave me alone” lesion) to differentiate it from follicular adenoma? Acta Radiol. 2009;50(4):383–388. doi: 10.1080/02841850902740940. [DOI] [PubMed] [Google Scholar]
- 10.Park M, Shin JH, Han BK, et al. Sonography of thyroid nodules with peripheral calcifications. J Clin Ultrasound. 2009;37(6):324–328. doi: 10.1002/jcu.20584. [DOI] [PubMed] [Google Scholar]
- 11.Park YJ, Kim JA, Son EJ, et al. Thyroid nodules with macrocalcification: sonographic findings predictive of malignancy. Yonsei Med J. 2014;55(2):339–344. doi: 10.3349/ymj.2014.55.2.339. [DOI] [PMC free article] [PubMed] [Google Scholar]
- 12.Seiberling KA, Dutra JC, Grant T, et al. Role of intrathyroidal calcifications detected on ultrasound as a marker of malignancy. Laryngoscope. 2004;114(10):1753–1757. doi: 10.1097/00005537-200410000-00014. [DOI] [PubMed] [Google Scholar]
- 13.Shi C, Li S, Shi T, et al. Correlation between thyroid noule calcification morphology on ultrasound and thyroid carcinoma. J Int Med Res. 2012;40(1):350–357. doi: 10.1177/147323001204000136. [DOI] [PubMed] [Google Scholar]
- 14.Wu CW, Dionigi G, Lee KW, et al. Calcifications in thyroid nodules identified on preoperative computed tomography: patterns and clinical significance. Surgery. 2012;151(3):464–470. doi: 10.1016/j.surg.2011.07.032. [DOI] [PubMed] [Google Scholar]
- 15.Yang TT, Huang Y, Jing XQ, et al. CT-detected solitary thyroid calcification: an important imaging feature for papillary carcinoma. Oncol Targets Ther. 2016;9:6273–6279. doi: 10.2147/OTT.S113369. [DOI] [PMC free article] [PubMed] [Google Scholar]
- 16.Yoon DY, Lee JW, Chang SK, et al. Peripheral calcification in thyroid nodules: ultrasonographic features and prediction of malignancy. J Ultrasound Med. 2007;26(10):1349–1355. doi: 10.7863/jum.2007.26.10.1349. [DOI] [PubMed] [Google Scholar]
- 17.Zhu D, Chen W, Xiang J, et al. Diagnostic value of CT artifacts for solitary coarse calcifications in thyroid nodules. Int J Clin Exp Med. 2015;8(4):5800–5805. [PMC free article] [PubMed] [Google Scholar]


