
Fig. 3.
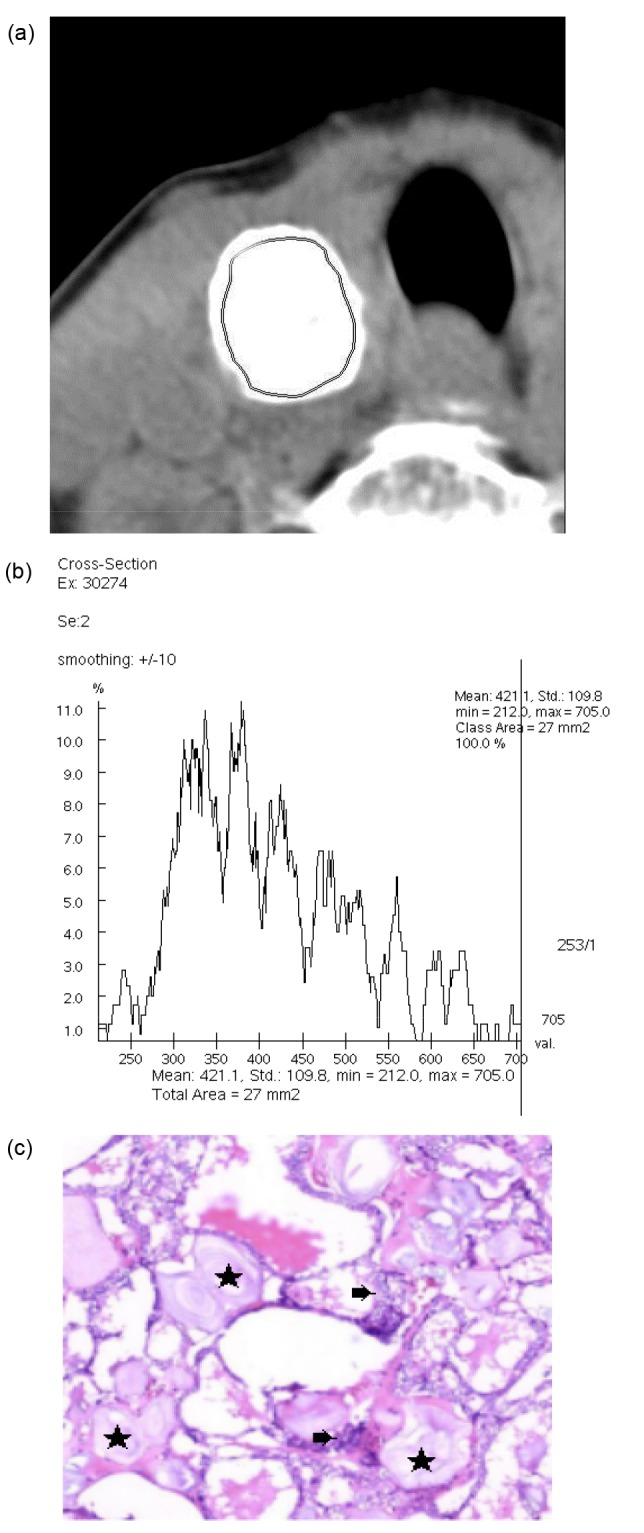
CT histogram and histopathology of MSCN
(a) The region of interest (ROI) measurement area of MSCN in the right lobe of the thyroid. (b) CT histogram shows the CT value of the ROI area and its distribution percentage. The mean CT value was 421.1 HU, ranging from 212 to 705 HU. (c) Hematoxylin and eosin staining (×100 magnification): calcification (★) and cancer tissue (➡)