
FIGURE 2.
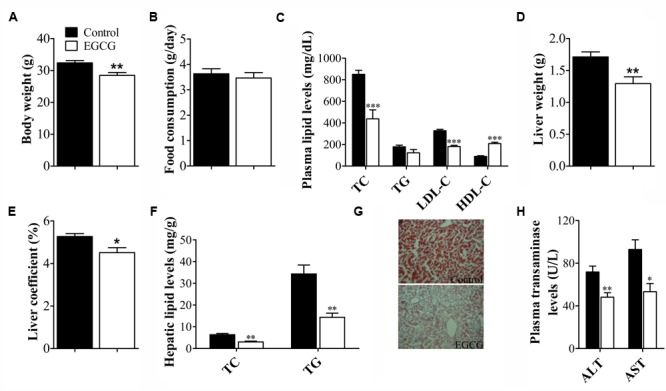
EGCG altered plasma lipid profile and hepatic lipid metabolism in ApoE-/- mice. ApoE-/- mice were fed with HFD and were treated daily with or without EGCG for 18 weeks by oral gavage, body weights, plasma lipid profile, and transaminase levels, and hepatic lipid accumulation was analyzed as described in the section “Materials and Methods.” (A) Bar graph showed the quantitative analysis of body weights (n = 15). (B) Bar graph showed the quantitative analysis of food consumption (n = 15). (C) Bar graph showed the quantitative analysis of TC, TG, LDL-C, and HDL-C levels in plasma (n = 15). Bar graph showed the quantitative analysis of liver weight (D) and liver coefficient (E) (n = 15). (F) Quantification of hepatic TC and TG levels (n = 15). (G) Morphology of hepatic lipid accumulation (magnification, ×200, n = 6). (H) Quantification of plasma AST and ALT activities (n = 15). ∗P < 0.05, ∗∗P < 0.01, ∗∗∗P < 0.001 compared with high-fat-fed ApoE-/- mice.