FIGURE 7.

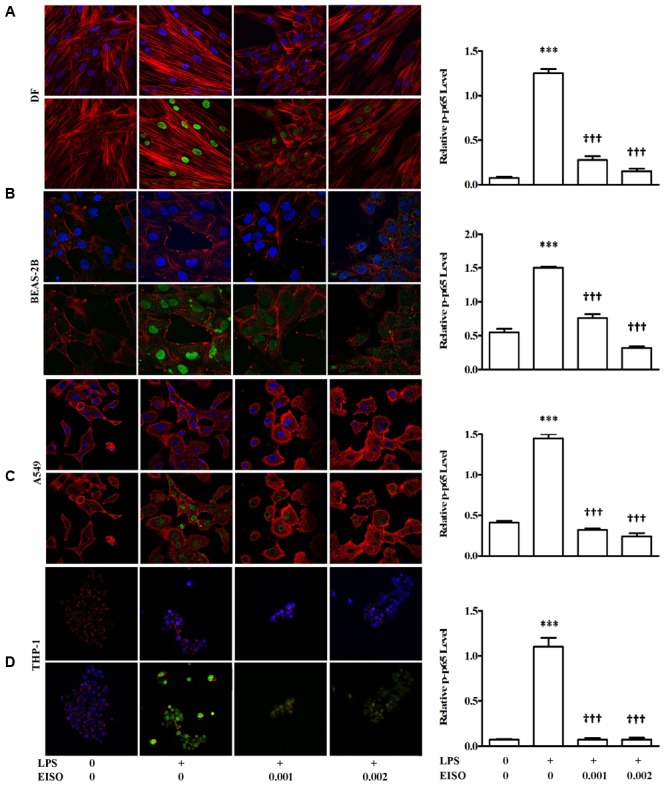
East Indian sandalwood oil suppresses p-p65 expression in DF (A), BEAS-2B (B), A549 (C), and THP-1cells (D). Cells were treated with vehicle (0), LPS (1 μg/ml), LPS + EISO (0.001 or 0.002%) for 48 h. Cells were stained for immunofluorescence imaging as described in Materials and Methods (left) to show p-p65 (green), actin filaments (red) and nuclei (blue). All stained slides were imaged using a 40× objective and identical post-capture magnification. p-p65 expression of all the four cell lines were also analyzed by ELISA (right). Data are mean ± SEM (n = 4).∗p < 0.05, ∗∗p < 0.01, and ∗∗∗p < 0.001 versus control; †p < 0.05, ††p < 0.01, †††p < 0.001 versus LPS-stimulated cells.
