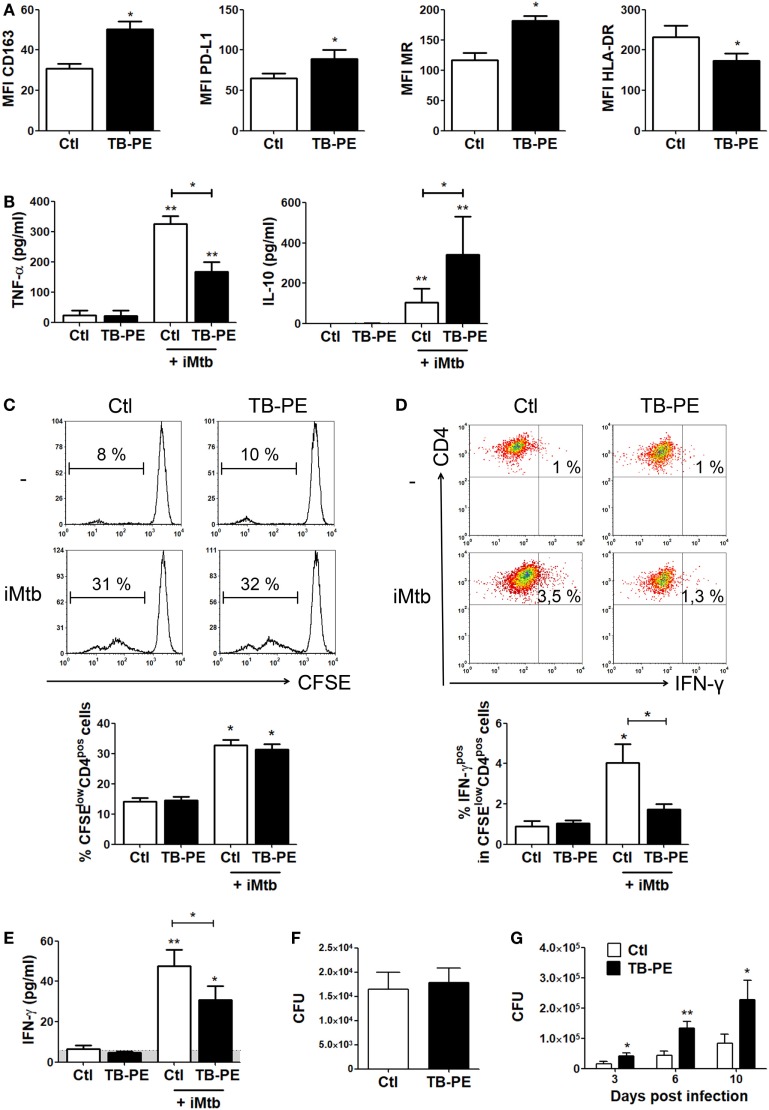
Figure 2.
Macrophages treated with tuberculous pleural effusion (TB-PE) display immunosuppressive properties. (A) Mean fluorescence intensity (MFI) of CD163, PDL-1, MR, and HLA-DR measured by flow cytometry in human monocyte-derived macrophages (MDM) exposed or not to TB-PE (n = 5). Wilcoxon signed rank test: *p < 0.05. (B) Levels of secreted IL-10 and TNF-α by MDM exposed or not to TB-PE in response to irradiated Mycobacterium tuberculosis (iMtb) measured by ELISA (n = 5). Friedman test followed by Dunn’s Multiple Comparison Test: *p < 0.05; **p < 0.01, for iMtb-stimulated vs unstimulated, or as indicated in the graph. (C–E) MDM from healthy PPD+ donors exposed or not to TB-PE for 24 h, were stimulated or not with iMtb for 24 h and then used as antigen presenting cells (APC) in autologous proliferation assays. Cocultures were performed with autologous carboxyfluorescein succinimidyl ester (CFSE)-labeled CD4 T cells at a ratio of 10 T cells: 1MDM. (C) Representative histograms showing CFSE labeling in CD4pos T cells activated by macrophages exposed (or not) to TB-PE, loaded (or not) with iMtb. Right panel shows the quantification of the percentages of proliferating CD4pos T cells (CFSElow/CD4pos cells) in each condition. Loaded vs unloaded with iMtb: *p ≤ 0.05 (n = 4). (D) Representative dot plots showing CD4 and IFN-γ expression among CFSElow/CD4pos T cells activated by MDM exposed (or not) to TB-PE, loaded (or not) with iMtb. Right panel shows the quantification of the percentages of proliferating IFN-γ-producing CD4pos T cells (IFN-γpos/CFSElow/CD4pos T cells) in each condition (n = 4). Friedman test followed by Dunn’s Multiple Comparison Test: *p < 0.05, for iMtb-stimulated vs unstimulated, or as indicated in the graph. (E) The amounts of IFN-γ released throughout the coculture were determined by ELISA. Friedman test followed by Dunn’s Multiple Comparison Test: *p < 0.05; **p < 0.01, for iMtb-stimulated vs unstimulated, or as indicated in the graph. (F) Bacillary loads in MDM treated (or not) with TB-PE, washed, and infected with Mycobacterium tuberculosis (Mtb) strain H37Rv for 4 h (n = 6). Wilcoxon signed rank test. (G) Intracellular colony forming units were determined at different time points in MDM treated with TB-PE for 24 h, washed and infected with Mtb (n = 10). Wilcoxon signed rank test: *p < 0.05; **p < 0.01; ***p < 0.001 for TB-PE treated vs Ctl.

