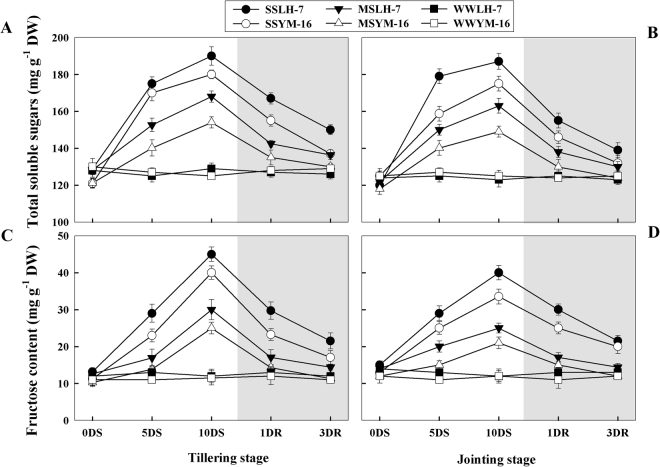
Figure 8.
Effect of drought stress (SS: severe stress, MS: moderate stress and WW: well watered) on total soluble sugars (A,B) and fructose (C,D) production in Luhan7 (LH-7) and Yangmai16 (YM-16) wheat cultivars. SS and MS treatments were applied at 35–40% and 55–60% soil field capacity (FC), respectively for ten days at tillering and jointing growth stages followed by re-watering, whereas WW was maintained at 75–80% FC. Time-course of the measurements was one day before stress (0DS), 5th and 10th day of stress (5DS, 10DS), 1 and 3 days after re-watering (1DRW, 3DRW). Shaded areas indicate the measurements taken following re-watering. Each vertical bar above the means indicates standard error of six replicates (n = 6) by using two-way ANOVA at P < 0.05.

