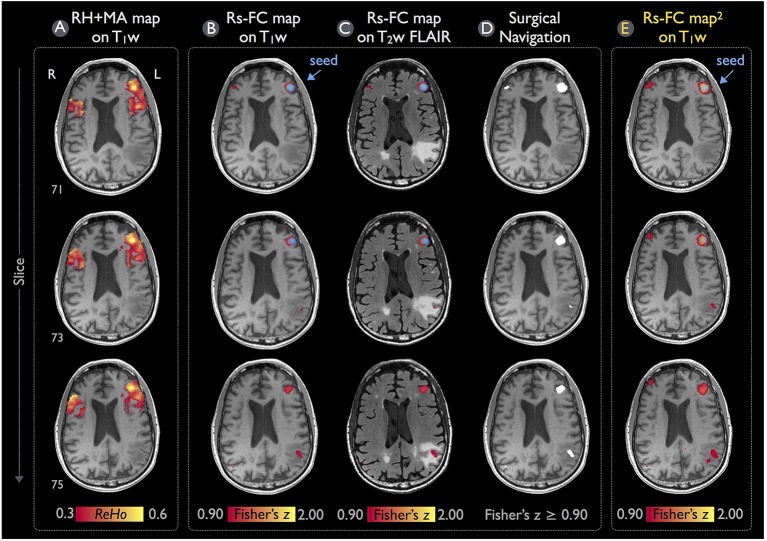
Figure 7.
Language mapping of rs-fMRI with seed guided by RH+MA map for Patient #2. (A) The RH+MA map with a ReHo threshold of 0.3 is overlaid on the T1w image. (B,C) Seeding at a local maximum of ReHo value (blue circle), the rs-FC map above the Fisher's z threshold of 0.9 is overlaid on the T1w and T2w FLAIR image. (D) The thresholded rs-FC map overlaid on the T1w image in the gray-scale DICOM format. (E) The rs-fMRI result analyzed independently from the IClinfMRI by using the procedure adopted in the previous study (Hart et al., 2016).

