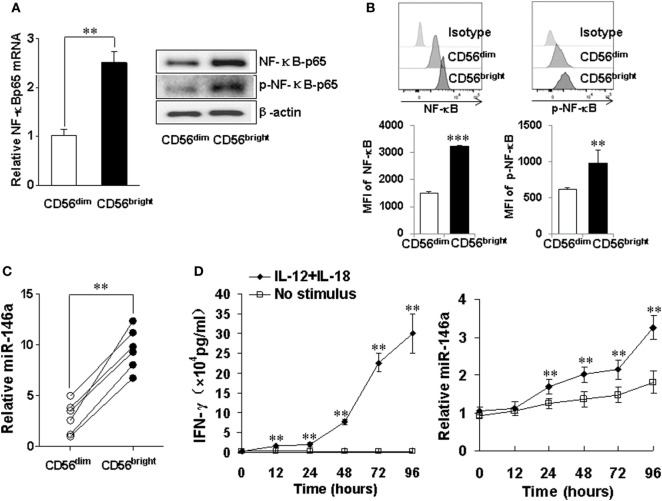
Figure 7.
miR-146a and NF-κB expressions in natural killer (NK) cell subsets CD56bright and CD56dim NK cells were sorted by a FACS Aria II cell sorter based on CD56 cell surface density, followed by assessment of NF-κB p65 mRNA and protein levels by qRT-PCR and immunoblotting, respectively (A). CD56bright and CD56dim NK cells were gated based on CD56 cell surface density and NF-κB p65 protein levels and phosphorylation levels were assessed by flow cytometric analysis (B). miR-146a expression was quantified by qRT-PCR in NK cell subsets (C). CD56bright NK cells were left unstimulated or co-stimulated with a combination of IL-12 (10 ng/ml) and IL-18 (100 ng/ml) for the indicated times, after which the supernatants were analyzed for IFN-γ production by enzyme-linked immunosorbent assay. Cell pellets were collected and used to prepare RNA and miR-146a expression and were quantified by qRT-PCR (D). This experiment is representative of at least four such experiments performed with similar results. Data shown are mean ± SD. *p < 0.05; **p < 0.01. Error bars represent SD.

