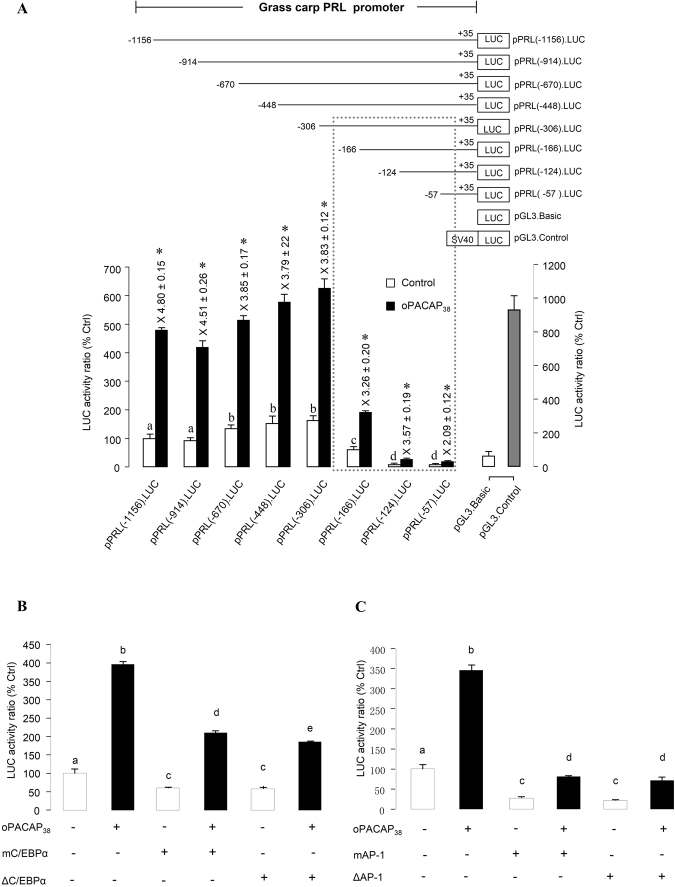
Figure 3.
Deletion, mutagenesis and truncation analysis of PRL promoter activity in αT3-1 cells. (A) Deletion analysis of the oPACAP38-induced PRL promoter activity. The upper panel is the schematic diagram for pPRL.Luc deletion constructs with decreasing lengths of PRL promoter from position −1156 bp to −57 bp. The lower panel depicts PACAP effect on the luciferase activity of PRL promoter with serial deletions in the 5′ end. (B) Mutagenesis and truncation analysis on the role of C/EBPalpha (located at −226 to −217 of pPRL(−306)) in oPACAP38-induced PRL promoter activity. (C) Mutagenesis and truncation analysis on the role of AP1 (located at −136 to −130 of pPRL(−166))in oPACAP38-induced PRL promoter activity. (Mutation construct for C/EBPα: mC/EBPα; mutation construct for mAP-1: mAP-1; truncation construct for C/EBPα: ΔC/EBPα; truncation construct for AP-1: ΔAP-1) After transfection with the deletion/mutation/truncation constructs of PRL promoter, αT3-1 cells were challenged with PACAP (10 nM) for 24 hrs. Parallel transfections with the promoterless pGL3.Basic and pGL3.Control carrying a pSV40 promoter were also conducted as the negative and positive control, respectively. Data of relative firefly luciferase expression (mean ± SEM) (n = 4) are presented with percentage of control by conversing the ratio of firefly and renilla luciferase. For deletion analysis, the significant increase in luciferase activity expression with respect to the corresponding control is denoted by an asterisk (P < 0.05, Student’s t Test). Significant difference p < 0.05 (ANOVA followed by Fisher’s LSD Test) between the basal level of each deletion construct is denoted by different letters. For the mutagenesis and truncation analysis, different letters denote a significant difference at p < 0.05 (ANOVA followed by Fisher’s LSD Test).

