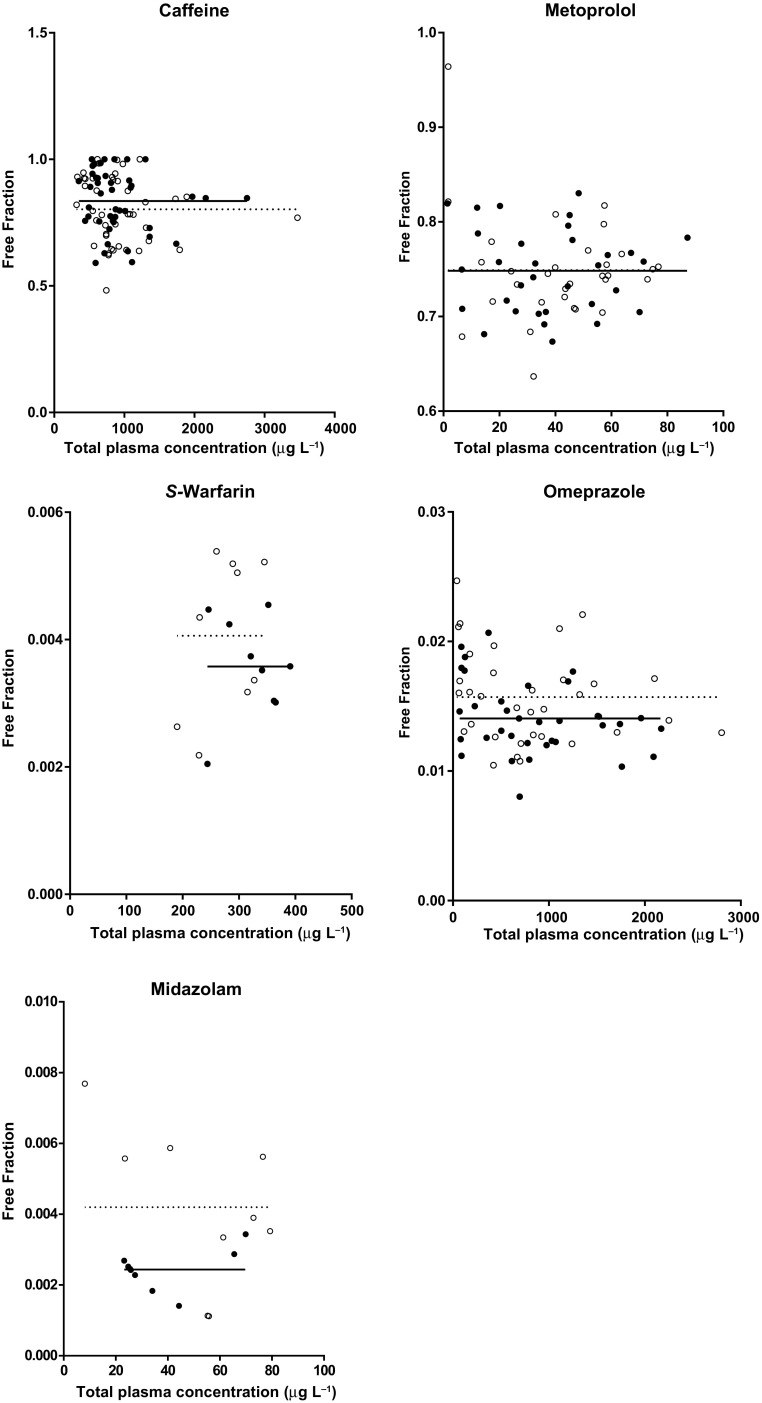
Fig. 2.
Distribution of the free fractions (ratio of free per total drug in plasma) versus the total plasma concentrations of the five probe drugs. The open circles represent the free fractions analyzed after the control intervention and the closed circles represent the short-term fasting intervention. The solid (short-term fasting) and dashed (control) lines represent the Y-intercepts for the best fits

