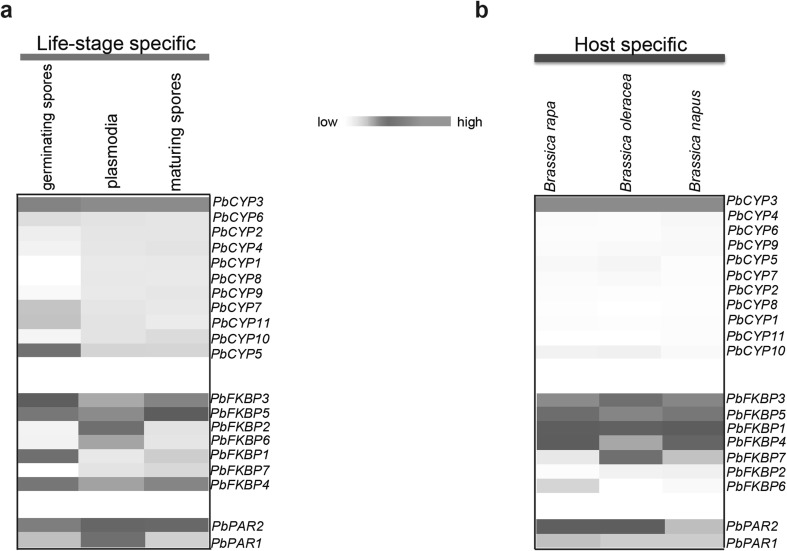
Fig. 2.
Expression patterns of the predicted immunophilins (IMMs) from P. brassicae. The heat maps show the RNAseq-based expression profile of IMMs during: a different Plasmodiophora brassicae life stages; germinating spores, plasmodia and maturing spores, and b different clubroot-infected Brassica hosts; B. rapa, B. napus and B. oleracea. The heat maps were drawn using the gplot package of R statistical software

