Figure 1.
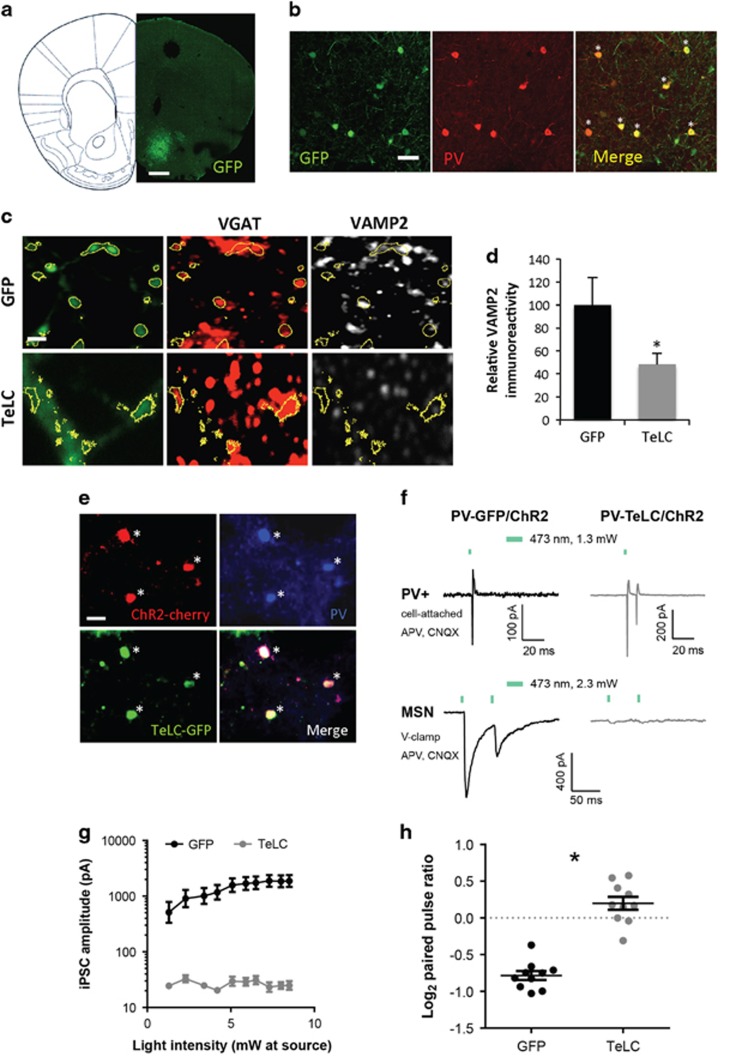
Cell-type specific AAV-mediated tetanus toxin light chain (TeLC) expression in PV+ GABAergic interneurons of the NAc in Pvalb-Cre mice. (a) Anatomical localization of stereotaxic viral injection in the mouse NAc. Coordinates AP: 1.18 mm from bregma, L: 1.18 mm, adapted from Franklin and Paxinos (2007). Scale bar, 0.75 mm. (b) Co-localization of AAV-mediated GFP expression (green) with PV immunoreactivity (red) in the NAc of Pvalb-Cre mice 3 weeks following stereotaxic viral infection. Colabeled cells are marked by an asterisk in the merge. Occasional GFP+/PV- cells (green in the merge view) are likely to have PV levels below our detection threshold as in Donato et al. (2013). Scale bar, 30 μm. (c) Identification of GFP+/VGAT+ synaptic terminals (yellow outlines) in the NAc of Pvalb-Cre mice infected with either TeLC-GFP (TeLC) or GFP as control for the assessment of VAMP2 expression. Scale bar, 2.5 μm. (d) Quantification of VAMP2 immunoreactivity in GFP+/VGAT+ terminals in the NAc of mice infected as in (c). n=4 mice/virus; *p<0.05. (e) Cre-dependent, AAV-mediated co-expression of ChR2-mCherry (red) and TeLC-GFP (green) in PV+ (blue) neurons of the NAc. Scale bar, 15 μm. (f) Top: example traces showing light-evoked action potential firing in GFP/ChR2-expressing (left) and TeLC/ChR2-expressing (right) PV+ neurons in NAc. Action potentials were recorded in cell-attached mode. Bottom: Representative voltage clamp recordings showing MSN iPSCs evoked by paired-pulse photoactivation of nearby PV+ neurons expressing GFP/ChR2 (left) or TeLC/ChR2 (right). Green bar indicates light on. (g) Amplitudes of iPSCs evoked by the first light pulse in MSN recordings from PV-TeLC/ChR2 and PV-GFP/ChR2 mice. (h) Assessment of GABAergic release probability from PV+ neurons onto MSNs by comparing log2 paired-pulse ratios (PPR) between GFP and TeLC groups. n=9 MSNs from PV-GFP/ChR2 mice and 10 MSNs from PV-TeLC/ChR2 mice, *p<0.05.

