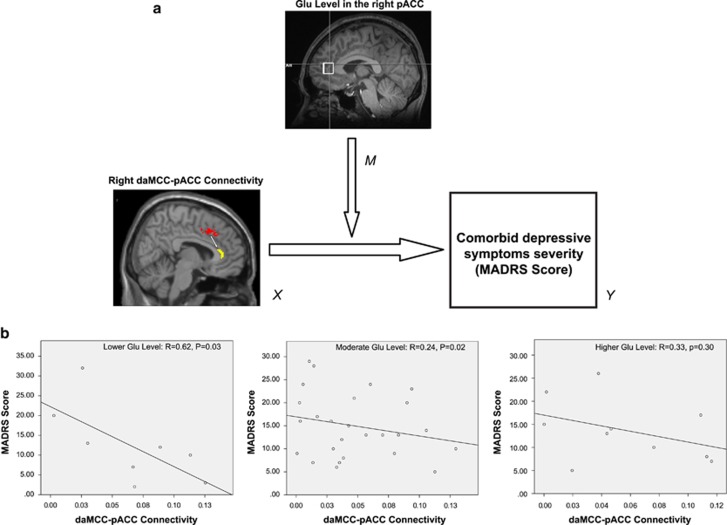
Figure 3.
(a) Schematic demonstration of the moderation analysis with depressive symptom severity. MADRS is the output variable (Y), the right daMCC-pACC connectivity is the independent variable (Y), and Glutamate (Glu) level in the right pACC is the moderator (M) between X and Y. (b) Scatterplots illustrate the association between X and Y among OCD participants with relatively lower (n=8, Left), moderate (n=25, Middle) and higher (n=10, Right) levels of Glu in the right pACC seed. MADRS, Montgomery-Åsberg Depression Rating Scale; daMCC, dorsal anterior midcingulate cortex; pACC, pregenual anterior cingulate cortex; OCD, obsessive-compulsive disorder.

