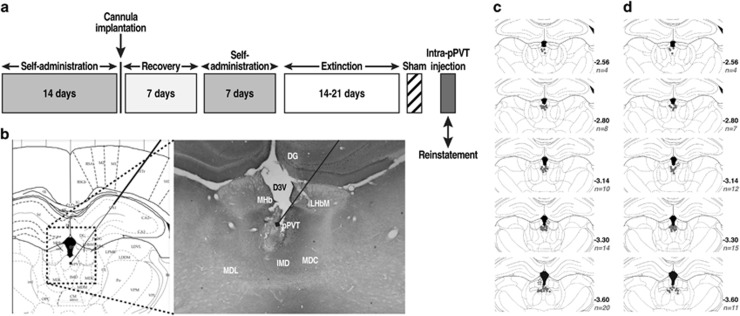
Figure 1.
(a) Behavioral procedure. (b) Schematic representation of injector placements in the pPVT (Paxinos and Watson, 1997), with photo representation of the injection track (× 2.5 magnification). (c) Injection sites for cocaine and (d) SCM animals. These schematics represent coronal sections of rat brains encompassing the midpoint of accurate injection sites (gray dots) in the anterior–posterior plane. All drawings are based on the atlas of Paxinos and Watson (1997). The n values on the graphs represent the number of animals/coronal sections. Gray stars represent missed injections (three for cocaine and one for SCM).

