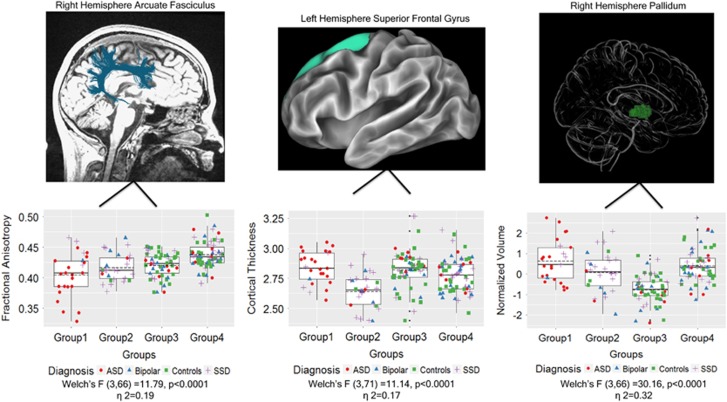
Figure 2.
Distinct neural circuit profiles of the data-driven groups. Evidence of distinct brain-circuit profiles for the data-driven groups. Pictured are the most influential regions or tract for each neuroimaging index (left to right): differing fractional anisotropy profiles of groups for the right arcuate fasciculus, differing cortical thickness profiles of groups for left superior frontal gyrus, and differing subcortical volume profiles of groups for the right pallidum. Note: median (solid) and mean (broken line) scores depicted.

