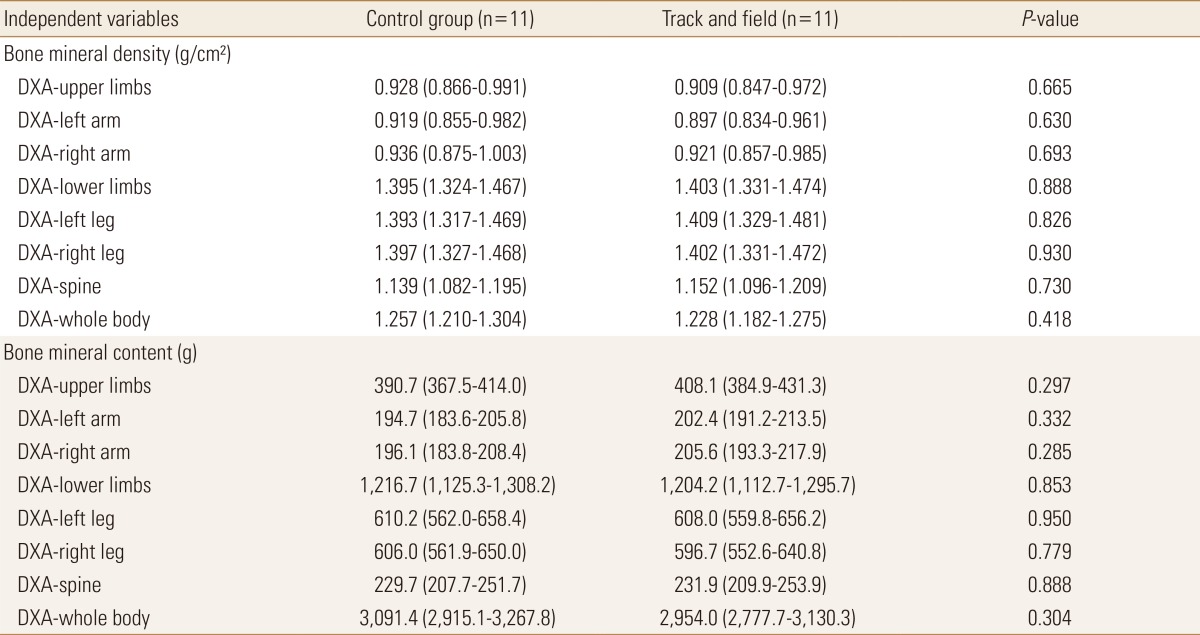
Table 4. Comparison of bone variables between groups adjusted by confounding factors among boys (n=22).
The data is presented as mean (95% confidence interval). Model adjusted by years from peak height velocity, vitamin D intake and lean soft tissue of body segment (except in the DXA-spine that was not adjusted by lean soft tissue).
DXA, dual energy X-ray absorptiometry.

