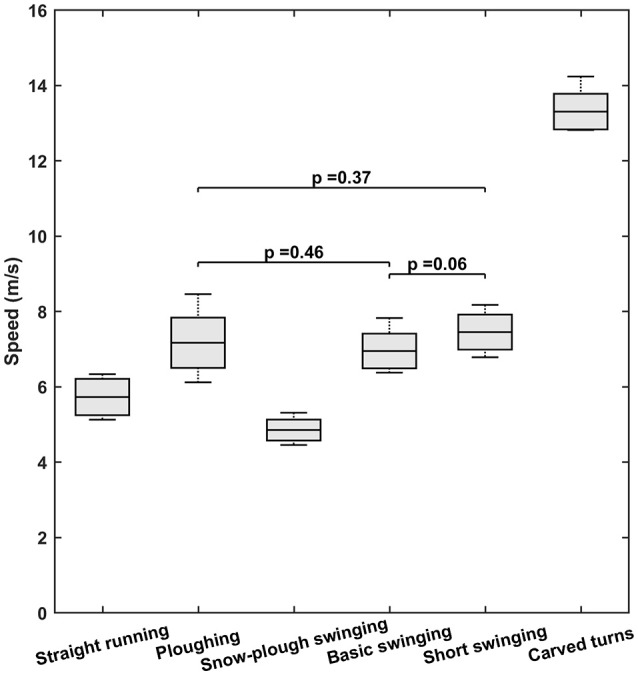
Figure 4.

Speeds with the six different types of skiing. In each box, the central line indicates the mean and the bottom and top edges the standard deviation. The whiskers extend to the maximal and minimal data points. Note that for more effective presentation, the p-values for pairs that did not differ significantly are the only ones shown.
