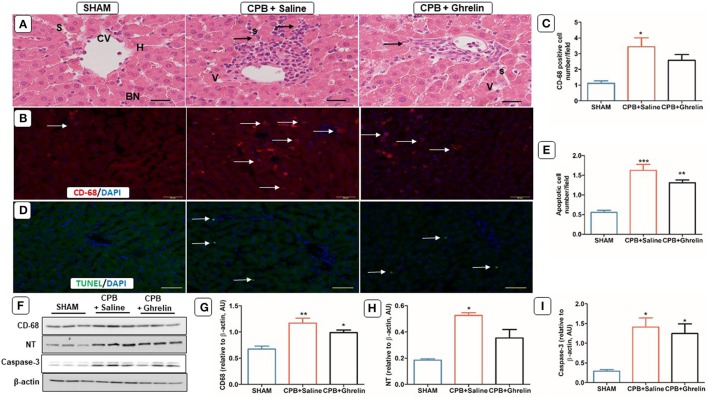
Figure 6.
Ghrelin treatment improved liver inflammation, oxidative stress but not apoptosis in rats following CPB. (A) H&E stained liver section of a sham rat showing normal features of central vein (CV), hepatocytes (H), sinusoids (S) and bi-nucleated cells (BN); a CPB rat showing increased mononuclear cell infiltration (black arrows) and vacuolated cells (V); a ghrelin treated rat showing fewer V and infiltrating cells (black arrows). (B) Immunofluorescence staining was used to access the levels of CD-68 macrophage (red stain; white arrows) positively-staining in the liver. In all images the scale bar is 50 μm. (C) Quantitative measurement of CD-68 positive cell number/field across 20 fields. (D) In situ TUNEL-assay was used to assess the apoptotic cell number (green stain; white arrow)/field across 20 fields in liver. Nuclei were labeled with 4′, 6-diamidino-2-phenylindole (DAPI, blue). The merged image is presented in this figure. In all images scale bar is 50 μm. (E) Quantitative measurement of apoptotic cell number/field across 20 fields. (F) Protein expression levels of CD-68, NT and caspase-3 detected by Western blotting. β-actin was used as an internal control. (G–I) Bar graph showing the densitometric analysis of the CD-68 and NT caspase-3 Western blots. The data shown are the mean ± SEM; N = 3 rats per group. Data were analyzed by a one-way ANOVA followed by Tukey's post hoc test. *p < 0.05, **p < 0.01, ***p < 0.001 vs. sham group.

