Figure 1.

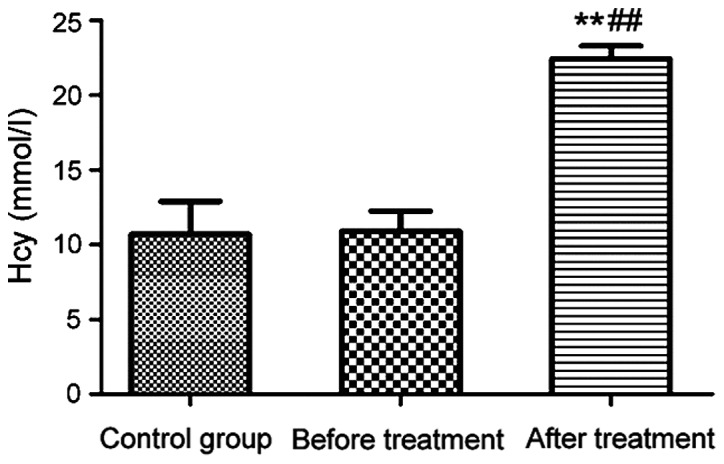
Plasma Hcy levels of the control group and patients with epilepsy before and after treatment. **P<0.01, compared with the control group; ##P<0.01, compared with patients before treatment.

Plasma Hcy levels of the control group and patients with epilepsy before and after treatment. **P<0.01, compared with the control group; ##P<0.01, compared with patients before treatment.