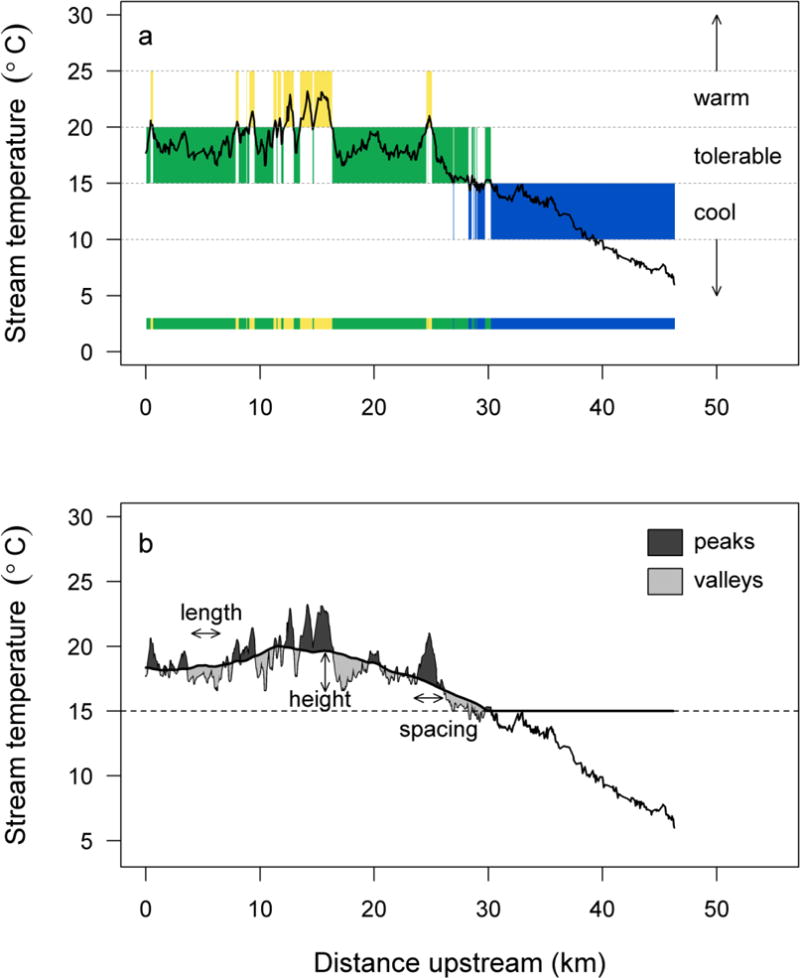
Fig. 2.

(a) Example of cool, tolerable, and warm thermal zones in a longitudinal stream temperature profile defined by temperature thresholds of 15 and 20°C, for Eightmile Creek, a tributary to the Columbia River in Oregon (USA), surveyed on 3 August 2002. The shaded bar at the bottom provides a longitudinal depiction of the thermal zones. (b) Peaks and valleys within areas that are warmer than 15°C indicate deviations in thermal infrared data from a 10-km moving average (thick black trend line). Annotations illustrate patch length, height, and spacing metrics
