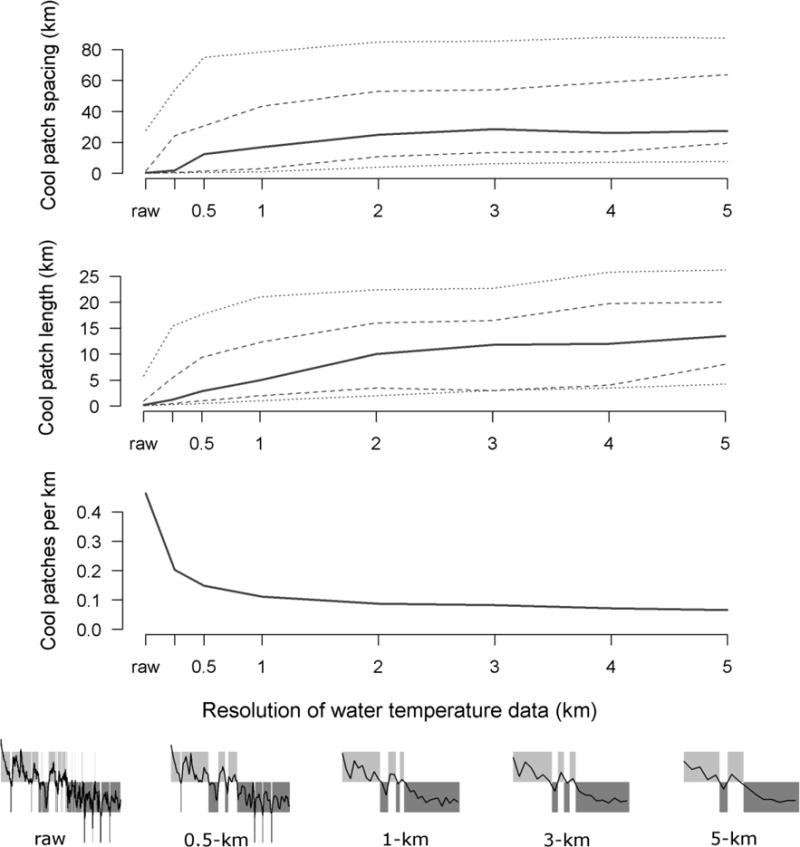
Fig. 4.

Spacing, length, and density of cool patches (<15°C) as a function of the spatial resolution of the data. X-axis tick marks indicate resolutions we examined: raw is the original thermal infrared survey data, and numeric values indicate data that were aggregated at 0.25-, 0.5-, 1-… and 5-km resolutions. Solid lines are medians, dashed lines are quartiles, and dotted lines are 10th and 90th percentiles. The 5 panels below the bottom panel illustrate the effect of decreasing spatial resolution on the quantification of thermal patches (plotted as in Fig. 2a)
