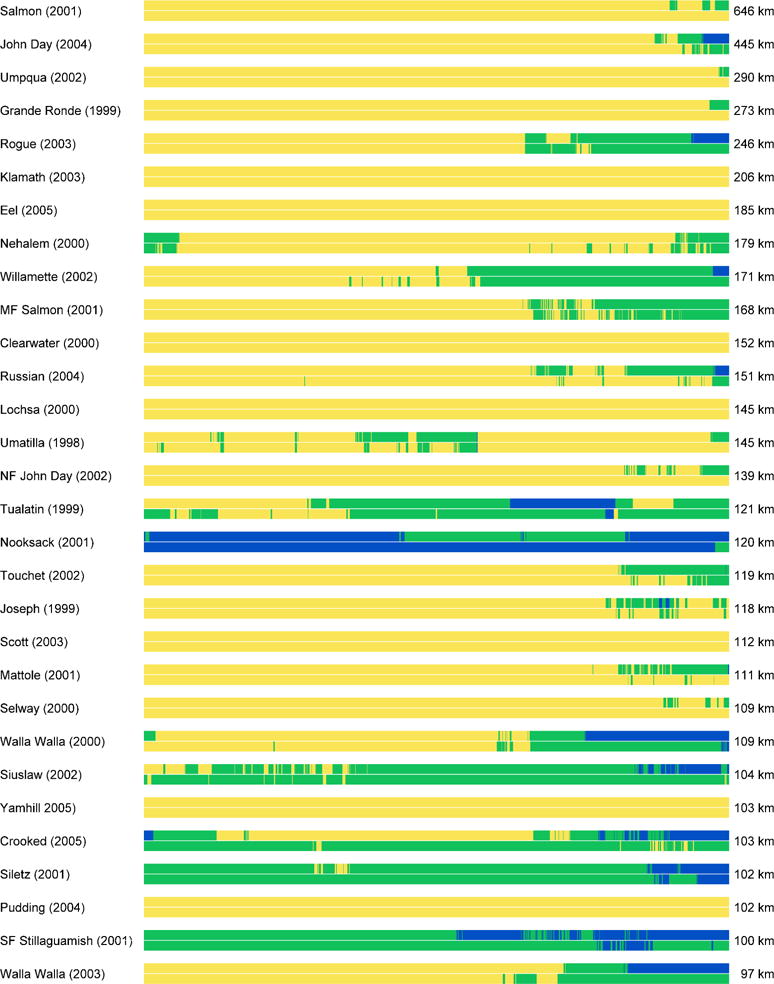
Fig. 5.

Thermal heterogeneity in longitudinal profiles, depicted as proportional linear distance from the bottom of each survey (left) to the top of each survey (right). For each river, shading denotes patches >20°C (dark gray), 15–20°C (gray), and <15°C (light gray) based on analysis of thermal infrared data surveyed in the year denoted parenthetically (top portion of each bar) and projected thermal heterogeneity for the 2080s based on random forest models (bottom portion of each bar). Patterns are illustrated for the 30 longest surveys and for the parts of the river that are accessible to anadromous fish; results for shorter surveys are provided in Online Resource 1
