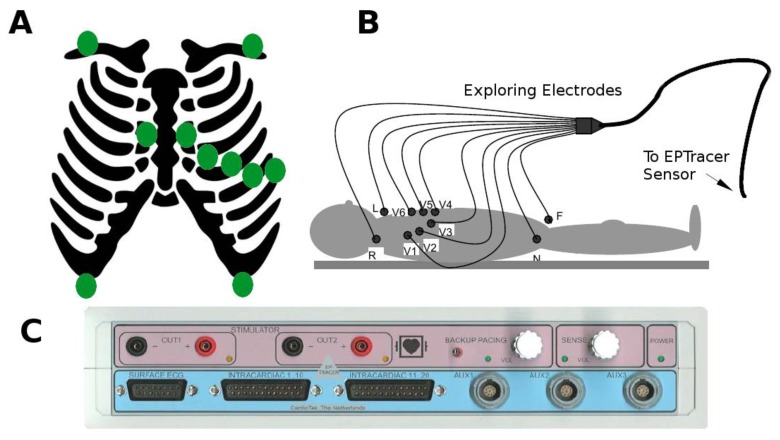
Figure 1.
Electrocardiogram (ECG) recording and characteristics of the EPTracer sensor. (A) Schematic diagram representing the standard position of the exploring electrodes (green dots) on the body surface. (B) According to the position of the exploring electrodes on the body surface, and the configuration of pairs for computing differences in potential, the ECG signals receive standardized names. L, R, F, V1, V2, V3, V4, V5, and V6 constitute the differences in potential between the corresponding electrode and an indifferent electrode (central terminal of Wilson). In addition, three ECG signals are computed as the algebraic sum of potentials at different pairs of electrodes (lead I = L + R; lead II = R + F; Lead III = L + F). (C) EPTracer sensor front panel.

