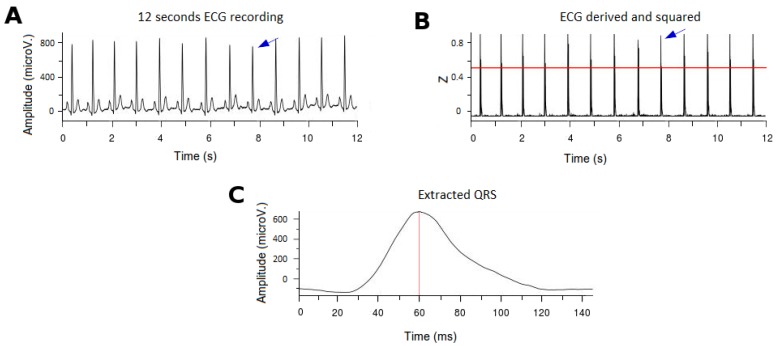
Figure 2.
Example of the ECG processing and the QRS extraction. (A): Surface ECG (12 consecutive seconds). The blue arrow indicates a QRS complex. (B) Signal after derivation, square elevation and typification. The 0.6 threshold to detect the QRS complexes is denoted (red line). The blue arrow indicates a QRS complex after processing. (C) Example of an extracted QRS complex. The tMaxQRS is indicated by the red line. ECG: electrocardiogram.

