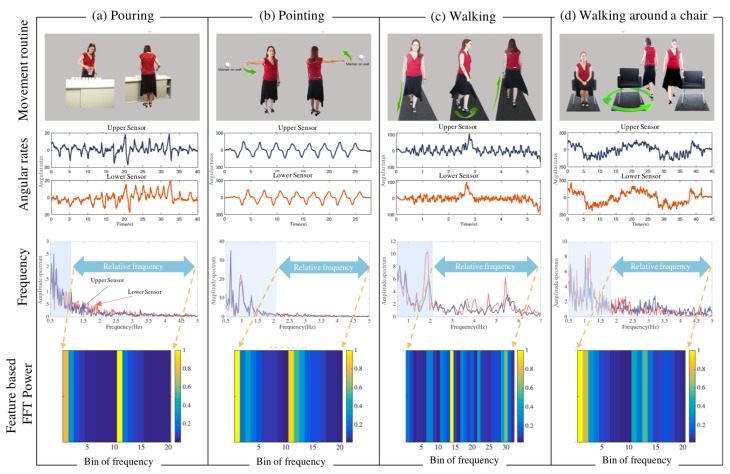
Figure 2.
Experimental setup and analysis. Figure (a–d) demonstrates movement routine for pouring, pointing, walking and walking around a chair; the second row depicts angular rates in time domain from sensors at the upper and lower; the third row indicates frequency domain (FFT) representation for each of the movement routine. Here, upper sensor (red) and lower sensor (blue), and the dominant frequency band is indicated in a shaded area; the fourth row shows examples of power spectral density of the relevant band forming the feature vectors.

