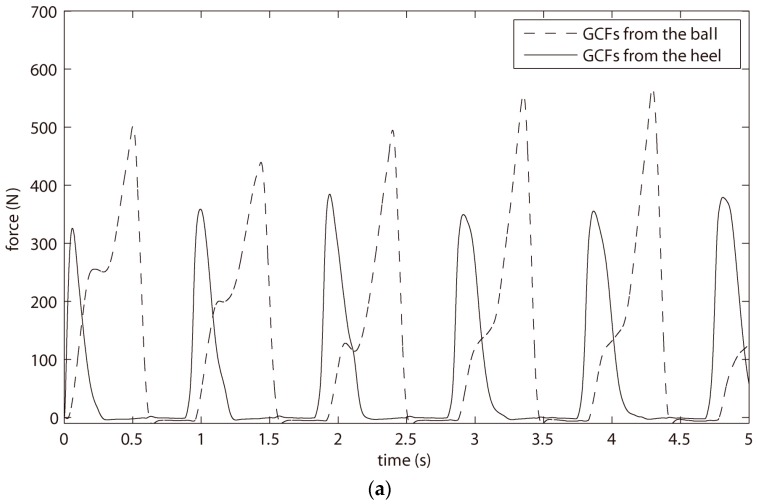
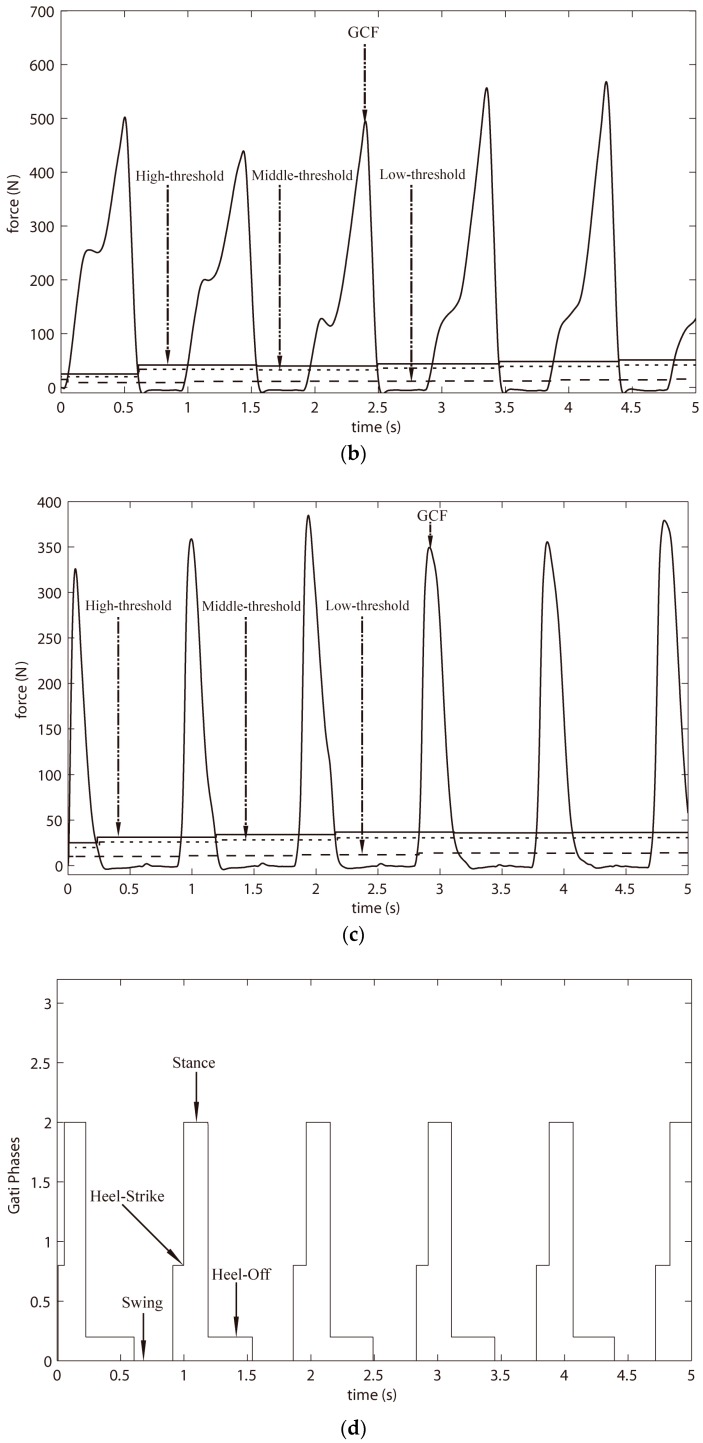
Figure 4.
(a) the GCFs of heel and ball measured by FSRs; (b) three self-tuning thresholds for the processing of GCF from the ball; (c) three self-tuning threshold for the processing of GCF from the heel; (d) the result of gait phase detection through GPDA; (e) thresholds calculated for the ball by four kinds of methods; and (f) thresholds calculated for the heel by four kinds of methods.


