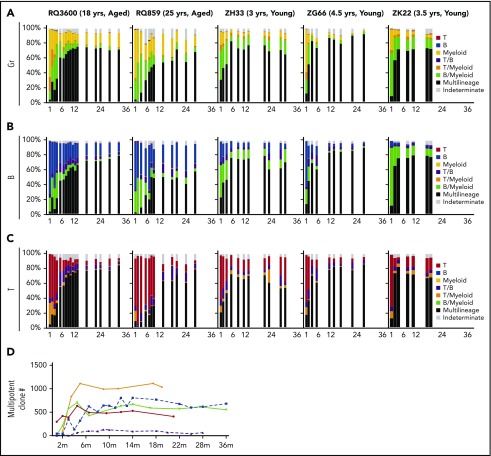
Figure 3.
Contributions of MP vs biased clones to hematopoiesis. The relative contributions of all MP, myeloid-biased (Gr), B-biased, T-biased, Gr/B-biased, Gr/T-biased, B/T-biased, and indeterminate clones (falling between unilineage and bilineage biased) across time after transplantation to Gr (panel A), B cells (panel B), and T cells (panel C). Each barcoded clone was categorized, and its fractional contribution to the lineage was summed to create the stacked bars. MP: ≤10-fold ratio of contributions between Gr, T, and B lineages (black); myeloid (Gr)-biased: >10-fold ratio of Gr vs T and B contributions (yellow); B-biased: >10-fold ratio of B vs Gr and T contributions (blue); T-biased: >10-fold ratio of B vs Gr and T contributions (red); T/myeloid-biased: T and Gr both >10-fold biased vs B and ≤10-fold biased toward each other (orange); B/myeloid-biased: B and Gr both >10-fold biased vs T and ≤10-fold biased toward each other (green); T/B-biased: T and B both >10-fold biased vs Gr and ≤ 10-fold biased toward each other (purple); indeterminate: falling in between unilineage and bilineage definitions (gray). (D) Number of MP clones detected as contributing at each time point for young (solid lines) and aged (dotted lines) animals.

