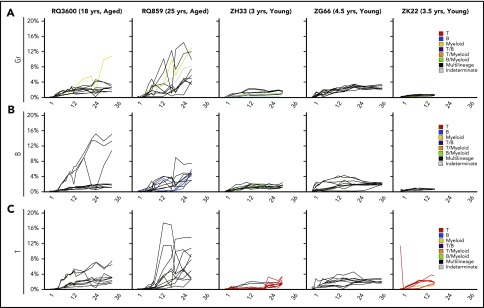
Figure 5.
Clonal expansion across time in aged vs young macaques. (A-C) Clonal contributions from individual clones were plotted for Gr (A), B cells (B), and T cells (C) across time. Each line represents a clone, and the y-axis indicates the percent clonal contribution. The 10 most abundant clones in each lineage at the latest time point were tracked across time. Line colors reflect clone type definitions and match those in Figure 3. MP: black lines; myeloid (Gr)-biased: yellow lines; B-biased: blue lines; T-biased: red lines; T/B-biased: purple lines; T/myeloid-biased: orange lines; B/myeloid-biased: green lines; indeterminate: gray lines.

