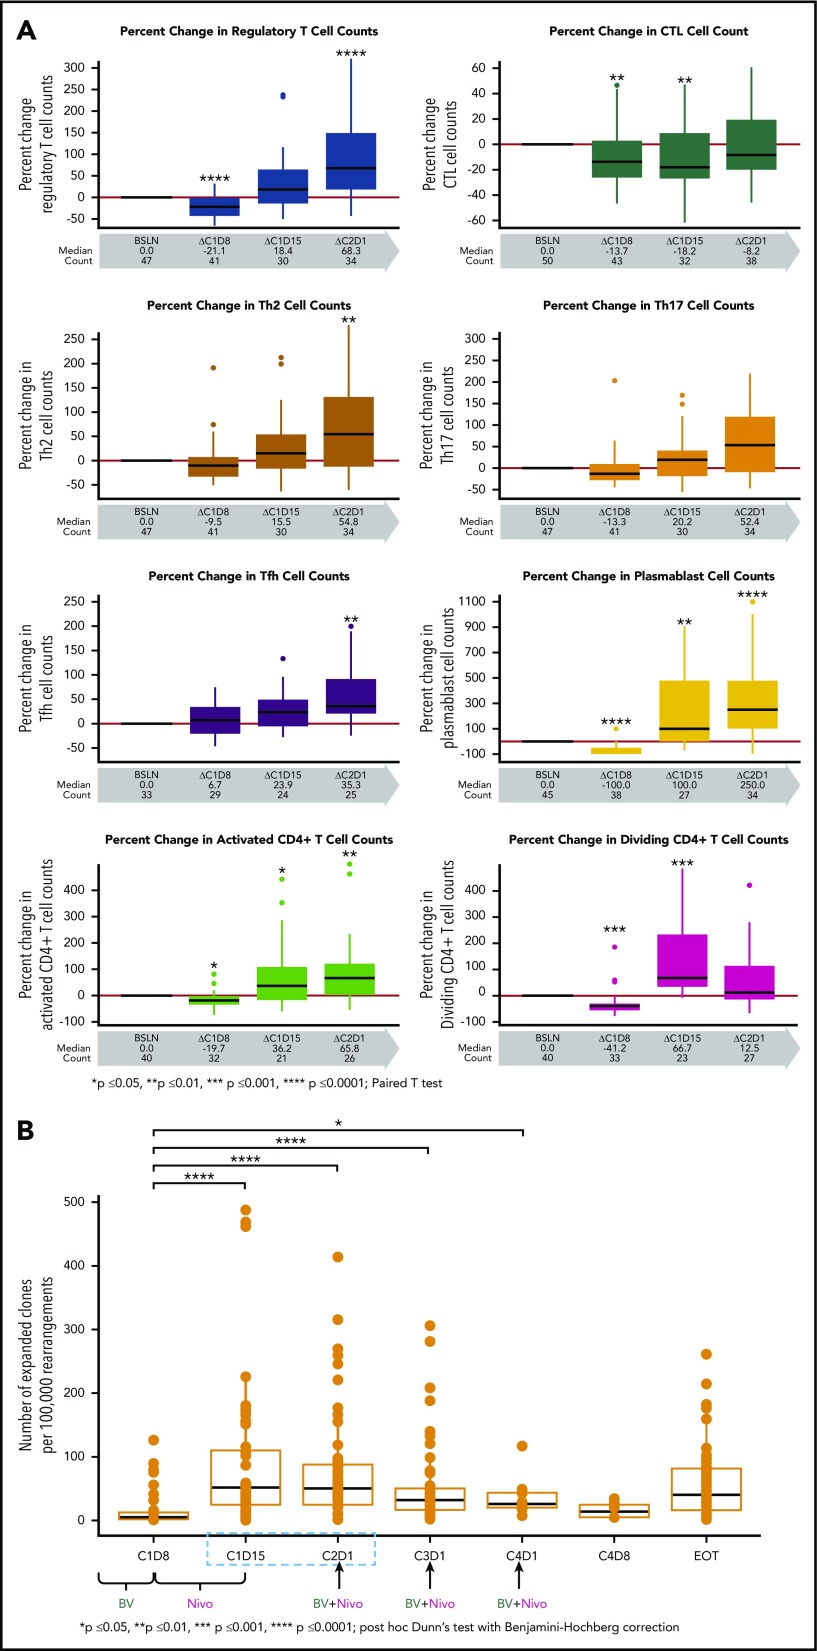
Figure 3.
Flow cytometry results for immunophenotyping T-cell subsets and frequency of T-cell clones in the peripheral blood. (A) T-cell immunophenotyping included Tregs as defined by CD4+CD25+CD127low/−CCR4+; cytotoxic T cells (CTLs) as defined by CD8+; TH2 as defined by CD4+ CXCR3-CCR6-CCR4+; TH17 as defined by CD4+CXCR3-CCR6+CCR4+; T follicular helper (Tfh) CD4+CD45RA-CXCR3-CXCR5+; as well as for plasmablasts CD19+CD20-IgD-CD27+CD38hi. Activated and dividing CD4+ are defined by HLA-Dr and Ki67 expressions, respectively. (B) The frequency of T-cell clones per 100 000 clones is shown relative to baseline during the treatment course. P values were calculated for (A) and (B) using the paired t test (GraphPad Prism) and post hoc Dunn test with Benjamini-Hochberg correction, respectively.

