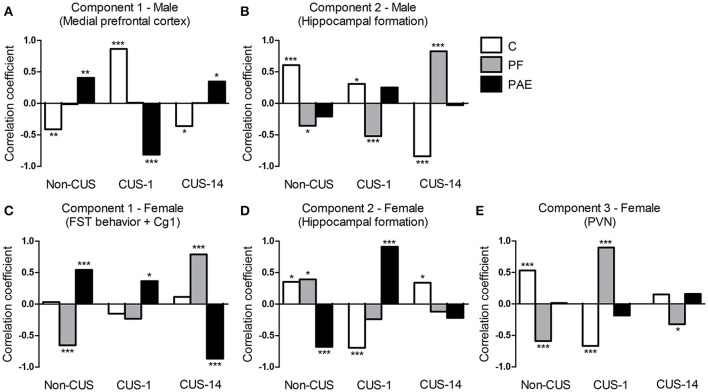
Figure 8.
Correlations between the component scores and experimental groups extracted from the constrained principal component analysis. Bars represent the correlation coefficients between component scores and experimental groups (i.e., simple effects of prenatal treatment × CUS exposure interaction) for males (A,B) and females (C–E). ***p< 0.001; **p < 0.01; *p< 0.05. C, control; PF, pair-fed; and PAE, prenatal alcohol exposed.

