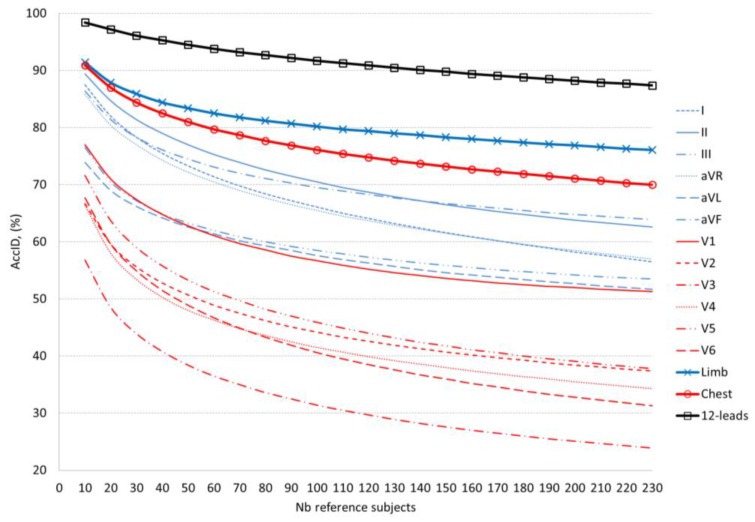
Figure 5.
Mean value of the validation AccID in function of the number of reference subjects (data in Table 6). The graphs are presented in respect of the ECG lead set implemented in the model: Blue lines: Single limb leads (dashed lines) and all limb leads (solid line); Red lines: Single chest leads (dashed lines) and all chest leads (solid line); Black lines: 12-leads.

