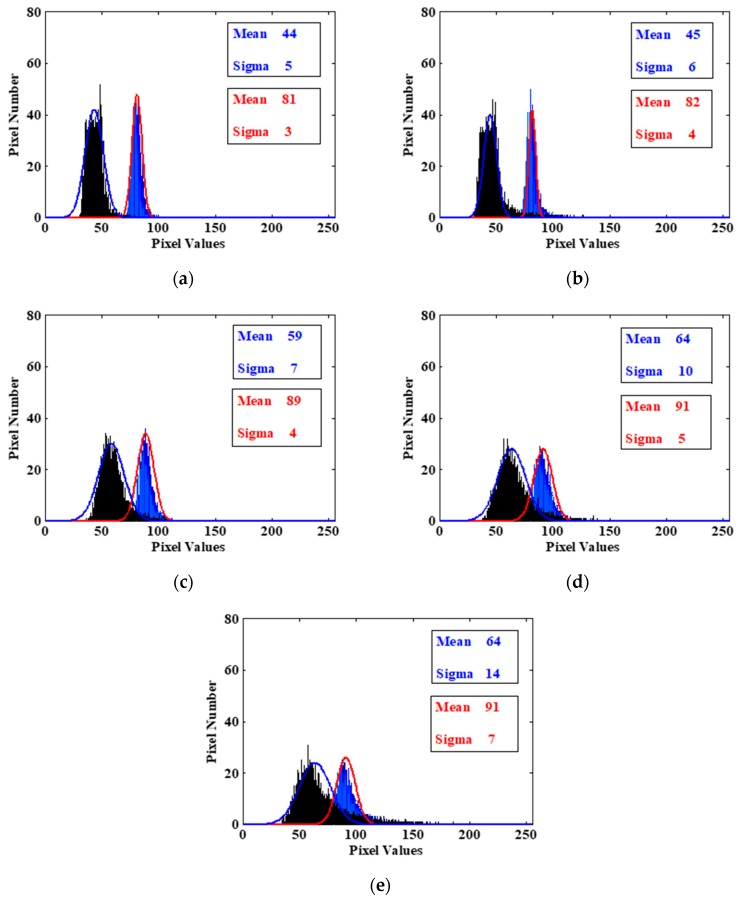
Figure 6.
(a) The histogram comparison of the dark and bright rectangle areas in Figure 4a. (b) The histogram comparison of the dark and bright rectangle areas in Figure 4b. (c) The histogram comparison of the dark and bright rectangle areas in Figure 4c. (d) The histogram comparison of the dark and bright rectangle areas in Figure 4d. (e) The histogram comparison of the dark and bright rectangle areas in Figure 4e.

