

Abstract
Objective
The present study examined the extent to which the covariance structure of the WAIS-IV is best accounted for by models that assume that test performance is the result of group level factors and multiple independent general factors.
Method
Structural models with one to four general factors were evaluated with either four or five group-level factors. Simulations based on four general factors were run to clarify the adequacy of the estimates of the allocation of covariance by the models.
Results
Four independent general factors provided better fit than a single general factor for either models with four or five group-level factors. While one of the general factors had much larger loadings than all other factors, simulation results suggested that this might be an artifact of the statistical procedure rather than a reflection of the nature of individual differences in cognitive abilities.
Conclusions
These results argue against the contention that clinical interpretation of cognitive test batteries should primarily be at the level of general intelligence. It is a fallacy to assume that factor analysis can reveal the structure of human abilities. Test validity should not be based solely on the results of modeling the covariance of test batteries.
Keywords: Multidimensional models, Human Cognitive Abilities, Cross-validation, WAIS-IV
One of the principal arguments for the construct of general intelligence, or g, is the fact that a matrix of correlations between diverse cognitive tests can be described as a positive manifold (Carroll, 1993; Spearman, 1904). Alternative viewpoints hold that intelligence is best described as multiple independent abilities (e.g., Gardner, 1983; Guilford, 1956). However, in a survey of opinions, Reeve and Charles (2008) found that there seems to be a general consensus among experts that g is a valid construct. There are differing opinions as to the nature of the general factor (e.g., Kranzer and Jensen, 1991; Carroll, 1991). For example, Kranzer and Jensen (1991) concluded that individual differences in psychometric g are due to several independent sources of variance. In contrast, Carroll (1991) asserted that g is unitary.
Scores on a given test can be due to several sources of variance. These include general factors that affect all tests in a battery, group factors that affect a subset of tests, and specific factors that are unique to a given test (Rodriguez, Reise & Haviland, 2016). In many structural models of cognitive abilities, g is considered a general factor, abilities such as verbal comprehension are viewed as group-level factors affecting some but not all tests, and test-specific measurement error is viewed as one of many possible test-specific effects. Higher-order models of cognitive ability factors have been common in the past (e.g. Carroll, 1993). Higher-order models treat the effect of g on test performance as being mediated by group-level factors (Gignac, 2008). More recently, bi-factor models that treat g and group factors as independent have gained popularity (Reise, 2012). Bi-factor models provide better fit of the covariance in cognitive test performance than higher-order models (Beaujean, Parkin & Parker, 2014; Gignac & Watkins, 2013; McFarland, 2012; Valerius & Sparfeldt, 2014). In addition, due to the independence of general and group factors, the relative contribution of each to test performance can more readily be evaluated.
The concept of g may be antithetical to the modular view of mind held by many Neuropsychologists (Anderson, 2005). This view holds that performance on any given cognitive test is potentially the result of multiple factors (e.g., Kaplan, 1988; Franzen, 1989). Milberg, Hennen & Kaplan (2009) describe a number of distinct processes that might limit performance on single subtests of the Wechsler Adult Intelligence Scales- revised (WAIS-R). Likewise Warrington, James & Maciejewski (1986) reported that WAIS subtests were useful in the diagnosis of lesion localization. This view promotes the examination of different patterns of subtest performance. In contrast, some researchers hold that a single factor (g) accounts for most of the variance in cognitive test performance (Canivez & Watkins, 2010). This view holds that clinical interpretation should be primarily at the level of general intelligence and is based on factor analytic studies showing that most of the covariance between subtests can be accounted for by a single factor. Reynolds, Floyd & Nikkleksela (2013) also estimated the proportion of variance accounted for by a general factor and group-level factors. Although they also found a similar large portion of subtest covariation accounted for by the general factor they concluded that group factors explained a meaningful amount of variance. It is important to note that such estimates of variance accounted for are dependent on the particular statistical model considered. One of the goals of the present study is to evaluate such estimates by means of simulated test batteries.
Recently Kovacs and Conway (2016) proposed process overlap theory, a variant of the position that g is composed of multiple factors. Kovacs and Conway (2016) distinguish between compensatory models and noncompensatory models of multidimensional accounts of g. In compensatory models, the different dimensions combine in an additive manner. In contrast, noncompensatory models combine the separate dimensions in a nonlinear manner so that the final outcome is limited by the single lowest component. Noncompensatory models basically hold that a single weak link in a chain of cognitive processes is sufficient to preclude good performance. Detterman, Petersen & Frey (2016) provided a simulation of a noncompensatory model that they contend can account for the positive manifold. Given the non-additive nature of multiple abilities with noncompensatory models it would be difficult to identify the individual components of intelligence unless relatively pure tests of basic elements are used (Detterman et al., 2016). In contrast, given the additive compensatory model, it might be possible to identify individual elements provided that these have varying patterns of involvement on specific tests of mental abilities.
Kovacs and Conway (2016) also suggest that psychometric g is a formative construct. Latent variables of the formative kind are not conceptualized as causal determinates of measurements but rather as a composite summary of these measurements (Borsboom, Mellenbergh and van Heerden, 2003). Thus, Kovacs and Conway conceptualize g as a composite that emerges from rather than causes multiple sub-processes.
Murray and Johnson (2013) have questioned the wisdom of comparing bi-factor and higher-order models. Higher-order models can be conceptualized as models in which the ratio of the weights between any given group-level factor and g is constant (Reise, 2012). In contrast, bi-factor models do not have this constraint and hence have more degrees of freedom with which to fit the data. As a consequence, bi-factor models are more complex than higher-order models and are thus more prone to over-fitting (Cudeck & Henly, 1991). Overfitting occurs when model parameters account for chance characteristics of a sample rather than the underlying relationships they are intended to model. The problem of overfitting has frequently been dealt with by the use of cross-validation in statistics and machine learning (Arlot & Celisse, 2010; Brown, 2000; Mosier, 1951) and has also been recommended for covariance modeling, although it is rarely used (Browne and Cudeck, 1993; MacCallium, Roznowski & Necowitz, 1992). With cross-validation, model parameters are estimated with one sample (i.e., the training sample) and then these fixed parameter estimates are generalized to an independent sample. Overfitting is thus not an issue in assessing model fit in the second (i.e., the test) sample to which the model parameters were generalized. Anderson & Gerbing (1988) describe this procedure as “the quintessential confirmatory analysis” (page 412). The present study compares models differing in complexity with independent samples.
The present study was concerned with evaluating the possibility that multiple general factors can be identified with models of the covariance structure of the WAIS-IV. This provides a test of the suggestion of Kovacs and Conway (2016) that psychometric g is a formative construct. The statistical dissociability of general factors also depends on their being compensatory (i.e., they provide relatively independent contributions to test performance). In contrast to Kovacs and Conway (2016), the present study models WAIS-IV subscales using bi-factor and “multi-factor” models. In addition, due to their increased complexity, the resulting models are validated with independent samples. Furthermore, simulations of test battery performance are run to better understand the results of these analyses.
This study evaluates two hypotheses: 1) WAIS-IV sub-test covariance is better accounted for by several general factors than by a single general factor and 2) structural modeling tends to inflate the variance accounted for by a general factor. Empirical data from the WAIS-IV standardization sample is used to compare structural models with one or several general factors in terms of model fit and generalizability to new data. Simulated data with known characteristics is used to evaluate the accuracy of common estimates of variance accounted for by latent factors. Superior model fit by multiple general factors would support the concept that g is a formative construct representing several distinct abilities. A discrepancy between parameters actually generating the simulated data and estimates from structural models would question the logic of placing the most emphasis on a single general factor.
Method
Participants
This study used the data reported for the standardization sample of the WAIS-IV (Wechsler, 2008). Three samples were constructed consisting of data for individuals between 20 and 54 years of age (Tables A.3 through A.7, n= 1000), individuals between 16 and 19 years of age (Tables A.1 and A.2, n= 400), and individuals between 55 and 69 years of age (Tables A.8 and A.9, n= 400).
Analysis of Empirical Data
The 20-54 year-old sample from the WAIS-IV standardization data was used for parameter estimation and two additional samples were used for model validation with parameter values fixed to the estimates obtained from the 20-54 year-old sample. The 20-54 year-old sample was selected as the training data set since it is closer on average to the other two data sets than any other selection would be. Correlation matrices included all 15 subtests of the WAIS-IV. For each sample, tabled values were combined by first applying Fisher’s z transform, then averaging all of these values for each pair of subtests in a sample, and then taking the inverse transform to produce average r values. All correlations were positive and all tabled values were based on the same number of participants (i.e., 200) so that these factors were not considered in averaging r values. The assumption here is that the best model in the series can be identified by generalization to new data with estimated parameters fixed to the values determined from the training data. Since the correlations reported in Wechsler (2008) were computed within age groups, differences between these groups in terms of the mean and variance were eliminated. The resulting correlations thus reflect the relationships between test scores rather than simple trends occurring between age groups. One shortcoming of this approach is that more complex models that would be identified with generalization to an identical population might not be selected if there are large age related effects on these correlations. On the other hand, generalization to these samples represent what Mosier (1951) referred to as validity generalization since the new samples represent different populations rather than simply an additional sample from the same population and thus provide particularly strong evidence for the superior fit of the models in question.
All analyses were done with the SAS CALIS procedure (SAS, 2010) using default settings. All latent factors were set equal to 1 as recommended by Anderson & Gerbing (1988). Two sets of models for WAIS-IV group structure were constructed with varying numbers of general factors. Group factors were derived from the model presented in Figure 5.2 of the WAIS manual (four group factor model, Wechsler, 2008) and the model presented in Figure 3 of Benson and associates (5 group factor model, Benson, Hulac & Kranzler, 2010). These are the models with the best fit statistics reported by each author for the 15 subtests of the WAIS-IV. The Wechsler (2008) model has four first-order factors (i.e., verbal comprehension, perceptual reasoning, working memory and processing speed) and a second-order g factor. Benson et al. (2010) describe their model as a version of the Cattell-Horn-Carroll (CHC) model with five first-order factors (i.e., crystalized ability, visual processing, fluid reasoning, short-term or working memory and processing speed) and a second order g factor. The structure of the four group and one general factor model is illustrated in Figure 1 along with the corresponding two general factor model.
Figure 3.
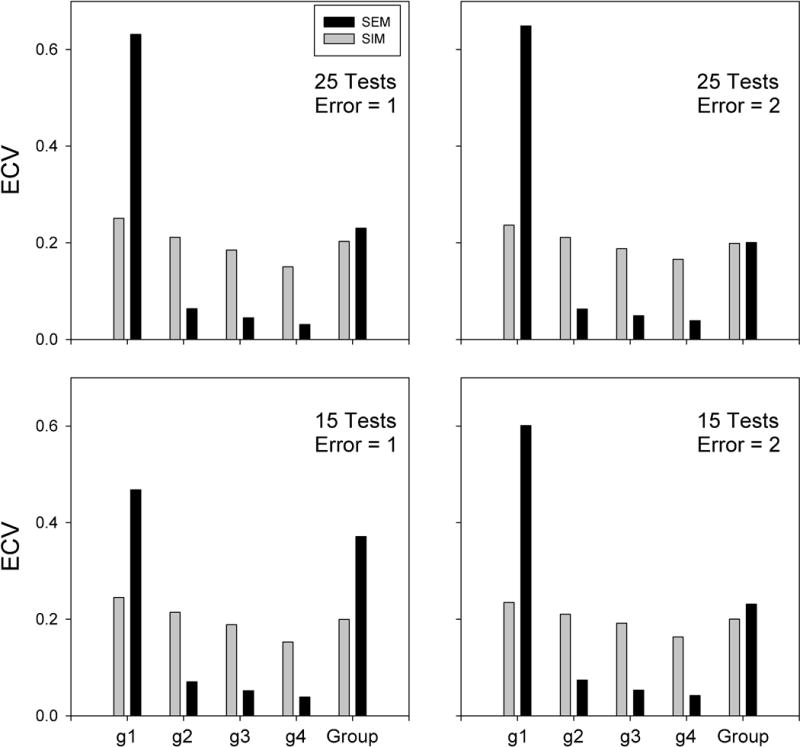
ECV for the simulated models. Each panel shows average ECV values of 50 simulated cases for both the actual weights used to compute the simulated data (gray bars) and the estimated weights determined from the simulated data (black bars). General factors for each simulation were sorted according to size prior to averaging (labeled g1, g2, g3, and g4 in order of magnitude). ECV for group level factors were combined (labeled Group).
Figure 1.
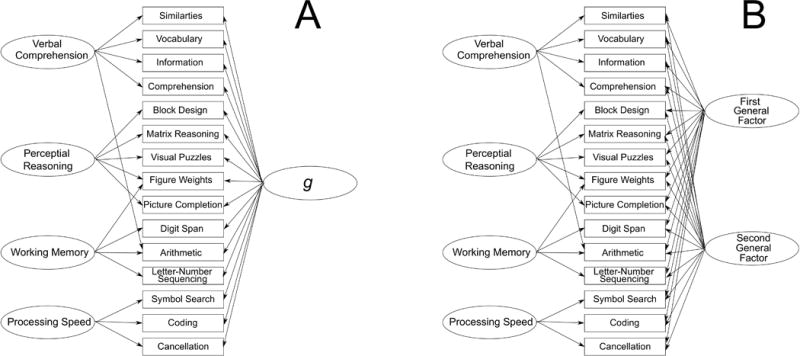
A. Basic structure of a bi-factor model of the WAIS-IV based on four group level factors. B. corresponding model with two general factors.
Simulations
Simulations were conducted to evaluate the extent to which estimates of variance accounted for accurately reflect actual contributions to test performance. Although there is no way of knowing the actual contribution of factors with empirical data, simulations can provide examples with known answers. However simulations only represent possibilities based on the parameters used. In the present series of simulations test scores were constructed based on linear models and Gaussian errors, which are generally assumed in covariance modeling. Weights for the general factors were drawn randomly from identical rectilinear distributions so that they should be approximately equal. For each condition, 50 models with different random draws of the factor weights were averaged so that results would not be peculiar to one specific sample. In addition, two levels of test error (1x and 2x) and two levels of number of tests (15 and 25) in the battery were included. Use of different amounts of error and number of tests were included to further insure the generality of the results. In this way the actual contributions to test score variance and the estimated contributions to test score variance could be compared for these hypothetical models.
All simulations were done in SAS. The basic model for the kth score on the ith test was:
| 1) |
where ajk is the magnitude of the jth ability for the kth observation, and ei is a random test-specific term. The value of wij is the weight given ajk on the ith test. The value of aij was unique to each individual within a test battery simulation and was drawn from the SAS normal distribution function. The value of ajk represents the ability of an individual on some hypothetical trait (e.g., an individual’s general intelligence or auditory processing ability) while the value of wij describes the role of these abilities in determining test performance (e.g., to what extent a test measures a general factor of intelligence or a group factor such as auditory processing).
Simulated test batteries consisted of either 15 or 25 tests, simulated with four general factors and four or five group factors. In addition, the amount of test-specific variance was varied (i.e., the value of ei being either 1x or 2x the value of the SAS normal distribution function, often referred to as error). All factors were uncorrelated and the sample size was 2000. Each of these conditions was simulated 50 times with different random values of wij for each of the multiple test battery simulations in order to extend the generality of findings. Each value of wij was unique to a single test battery simulation, and was drawn from the SAS uniform distribution function. Use of a uniform distribution insures that all abilities function in a similar manner within a given test battery simulation (i.e., if a given ability has positive effects on one test it would be expected to be more likely to have positive effects on other tests). This is a boundary condition for all of the simulations conducted in the present study and was more extensively investigated by McFarland (2012). These simulations were done with SAS 9.4 (64 bit version, SAS, 2010).
Results
A summary of model fit indices for the four group level models is presented in Table 1. The table shows χ2 and the GFI (goodness of fit index) for both the training and validation samples. RMSEA values (root mean square error) are shown only for the training data since indices such as RMSEA are adjusted by df which is identical for all validation models since all factor weights were fixed. The null model represents the case where only test-specific variance is modeled.
Table 1.
Model Fits for WAIS Standardization data modeled with four group-level factors. Model parameters were estimated using the data from ages 20 to 54 years (training data, n= 1000) and validated using data from ages 16-19 (validation 1, n= 1000) and 55-69 years (validation 2, n= 1000).
| Training Data | Validation 1 | Validation 2 | ||||||
|---|---|---|---|---|---|---|---|---|
| Model | df | χ2 | GFI | RMSEA | χ2 | GFI | χ2 | GFI |
| NULL Model | 105 | 8703.07 | 0.2519 | 0.2863 | 7550.98 | 0.2816 | 9326.92 | 0.2248 |
| Only General Factor | 90 | 1910.53 | 0.7507 | 0.1423 | 1736.64 | 0.7860 | 1712.93 | 0.7757 |
| Only Group Factors | 88 | 1809.30 | 0.7854 | 0.1399 | 1769.57 | 0.7721 | 2425.14 | 0.7473 |
| Group & 1 General factor | 73 | 270.28 | 0.9649 | 0.0520 | 474.74 | 0.9404 | 548.40 | 0.9334 |
| Group & 2 General factors | 58 | 159.05 | 0.9791 | 0.0418 | 447.26 | 0.9431 | 531.49 | 0.9340 |
| Group & 3 General factors | 43 | 97.66 | 0.9871 | 0.0357 | 427.90 | 0.9466 | 509.09 | 0.9376 |
| Group & 4 General factors | 28 | 45.46 | 0.9941 | 0.0250 | 383.99 | 0.9525 | 483.67 | 0.9406 |
| Group & 5 General factors | 13 | 26.18 | 0.9965 | 0.0319 | 397.33 | 0.9506 | 489.16 | 0.9404 |
Note: df= degrees of freedom, χ2= Chi Square statistic, GFI= goodness of fit index, RMSEA= root mean squared error of approximation.
As can be seen in Table 1, both a model with a single general factor and a model with only four group factors result in a large reduction in χ2 and other fit indices. Each successive addition of a general factor up to addition of the fourth factor results in a significant reduction in χ2 for the training data (p < 0.0001 in all cases). GFI and RMSEA decrease in the training sample up to addition of the fourth general factor. For validation samples there is a reduction in χ2 up to addition of the fourth general factor. However the significance of this effect cannot be evaluated as all generalized models have the same degrees of freedom. Thus, overall the results show that the use of four general factors produces the best fit for the four group factor models, although the reduction in model fit is progressively less with each addition.
A summary of model fit indices for the five group level models is presented in Table 2. Each successive addition of a general factor up to addition of the fourth factor results in a significant reduction in χ2 for the training data (p < 0.0001 in all cases). Addition of the fifth general factor was significant at p < 0.05. For validation samples there is a reduction in χ2 up to addition of the fifth general factor in the younger validation group and up to addition of the fourth general factor in the older validation group. Thus, overall the results show that the use of four or five general factors produces the best fit for the five group factor models, although the reduction in model fit is progressively less with each addition.
Table 2.
Model Fits for WAIS Standardization data modeled with five group-level factors. Model parameters were estimated using the data from ages 20 to 54 years (training data, n= 1000) and validated using data from ages 16-19 (validation 1, n= 1000) and 55-69 years (validation 2, n= 1000).
| Training Data | Validation 1 | Validation 2 | ||||||
|---|---|---|---|---|---|---|---|---|
| Model | df | χ2 | GFI | RMSEA | χ2 | GFI | χ2 | GFI |
| NULL Model | 105 | 8703.07 | 0.2519 | 0.2863 | 7550.98 | 0.2816 | 9326.92 | 0.2248 |
| Only General Factor | 90 | 1910.53 | 0.7507 | 0.1423 | 1736.64 | 0.7860 | 1712.93 | 0.7757 |
| Only Group Factors | 89 | 2519.88 | 0.6960 | 0.1653 | 463.70 | 0.9345 | 600.93 | 0.9277 |
| Group & 1 General factor | 74 | 302.53 | 0.9362 | 0.0556 | 450.58 | 0.9435 | 564.92 | 0.9230 |
| Group & 2 General factors | 59 | 213.54 | 0.9722 | 0.0512 | 431.62 | 0.9455 | 533.18 | 0.9343 |
| Group & 3 General factors | 44 | 109.62 | 0.9854 | 0.0386 | 390.33 | 0.9513 | 497.78 | 0.9396 |
| Group & 4 General factors | 30 | 52.03 | 0.9930 | 0.0271 | 379.83 | 0.9524 | 472.78 | 0.9426 |
| Group & 5 General factors | 15 | 25.68 | 0.9965 | 0.0267 | 367.12 | 0.9546 | 500.47 | 0.9391 |
Note: df= degrees of freedom, χ2= Chi Square statistic, GFI= goodness of fit index, RMSEA= root mean squared error of approximation.
Figure 2 shows the explained common variance (ECV, according to formula 2 of Reise, Moore and Haviland, 2010) for the four group, four general factor model and the five group, four general factor model. Both of these models were based on WAIS-IV correlations (fit indices summarized in Tables 1 and 2). The ECV values are presented separately for each of the four general factors (g1 through g4) and combined for the group factors. Figure 2 shows that the largest general factor accounts for a large portion of the variance in both models. This is the sort of result that leads some authors to conclude that the WAIS-IV should be interpreted primarily in terms of a single general factor (Canivez & Watkins, 2010). To the extent that ECV accurately reflects the magnitude of the actual processes generating the data, Figure 2 suggests that although the additional general factors account for a significant amount of variance, their contribution is minor.
Figure 2.
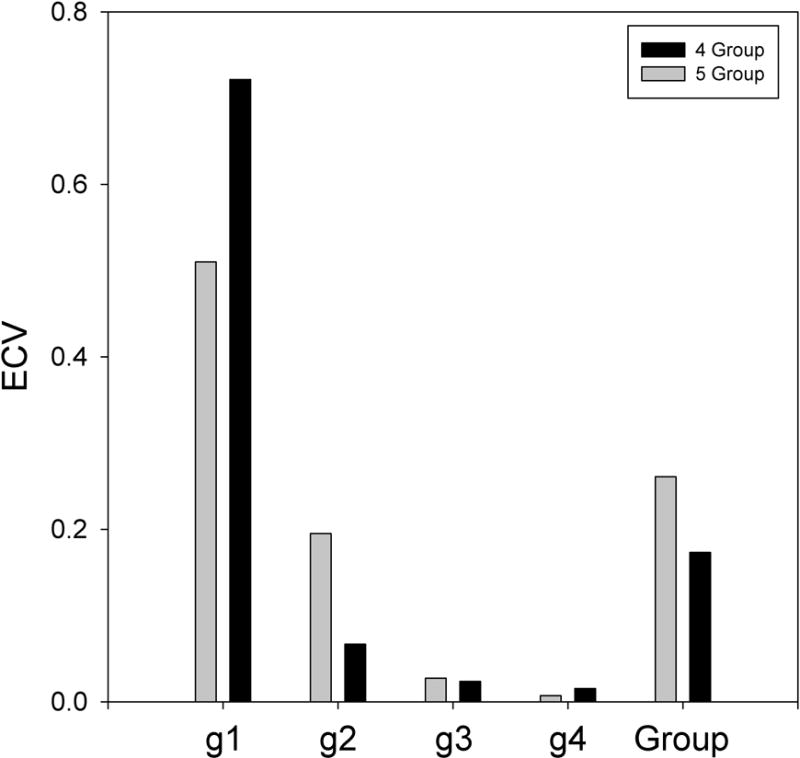
Explained common variance (ECV, according to Reise et al., 2010) for both four general factor models of the WAIS-IV standardization data. The ECV values are presented separately for each of the four general factors (labeled g1, g2, g3, and g4 in order of magnitude) and combined for the group factors (labeled Group). Black bars represent the four group factor model and gray bars represent the 5 group factor model.
Figure 3 shows the average explained common variance (ECV) values for the simulated models. Each panel shows average ECV values of 50 simulated cases for both the actual weights used to compute the simulated data and the estimated weights determined from the simulated data. General factors (g1 through g4) for each simulation were sorted according to descending size prior to averaging. The estimated results in each panel show a pattern similar to that displayed in Figure 2. However values for the actual weights used to simulate test scores show a different pattern. ECV values are fairly similar for all factors, as would be expected from the fact that all were drawn from the same probability distribution. The small variation between the sorted factors is due to sampling variation. Analysis of variance including type of weight (used to simulate data or estimated from simulated data), number of tests (15 or 25), amount or error (1x or 2x) and factor (each of the ordered general factors and the combined group factors) indicated that all of the effects involving factor number and its interaction with other effects were significant (p < 0.0001 in all cases). The largest effects in this analysis were due to the main effect of factor (df= 4/1960, F= 9368.18, p < 0.0001) and the type of weight X factor interaction (df= 4/1960, F= 6153.66, p < 0.0001). The interaction was due to the fact that the ECV of the largest estimated general factor was much larger than the ECV of the weights used to simulate the data. This means that the ECV estimates from structural modeling were inflated relative to the known weights used to simulate the data. The fact that weights used to simulate the data were much larger than those estimated from the same data by modeling (i.e., effect of type of weight) for several simulation parameters (i.e., number of tests, amount of error) indicates that this effect has some generality. Thus the largest general factor absorbed much of the variance in the covariance matrix which was actually generated by multiple independent factors.
Discussion
The present study found that the covariance between WAIS-IV scales was better accounted for by several general factors than by only a single general factor. Estimates of the explained common variance suggested that the largest general factor explained a disproportionate amount of the covariance between scales. However simulations showed that this was also the case when the actual weights used to compute test scores were approximately equal. These results do not support the contention that interpretation of the WAIS-IV should be primarily at the level of full scale scores (Canivez & Watkins, 2010). Rather the present results suggest that WAIS-IV subscale performance may be the results of multiple domain general factors, as suggested by others (e.g., Kaplan, 1988; Detterman et al., 2016; Kovacs and Conway, 2016; Kranzer and Jensen, 1991). Thus, this study is basically 1) a proof of principle regarding alternative organizations of mental abilities, and 2) a cautionary note about the use of factor analysis in understanding the former.
The intent of the present study is to show that the covariance structure of the WAIS-IV is complex rather than to advocate for a specific structural model. Indeed, I have previously evaluated multivariate models of the WAIS-IV (McFarland, 2013) although these models were not intended as tests of process overlap theory. It is likely that many alternative statistical models can perform similarly well. Although the results of factor analysis and structural modeling have been used to argue for test validity (Thompson & Daniel, 1996), selection of useful models require constraints by information external to the test batteries being evaluated. These external constraints include the extent to which models allow for accurate prediction of alternative indices of the construct that they are intended to represent (i.e., convergent and discriminant validity, (Campbell and Fisk, 1959)) and the extent to which they are consistent with what is known of brain functioning (McFarland, in press).
The present results suggest that g is an aggregate of many separate processes, as suggested by Kranzer & Jensen (1991). This is not to say that g may not be useful in some applications as it can provide a convenient overall summary of ability that may be useful for making global predictions of performance. However it is important to recognize that the fact that g absorbs much of the variance in test scores does not preclude the use of specific tests and scales for differential diagnosis or characterizing client strengths and weaknesses. Indeed, interpretation of specific test scores is currently common practice in neuropsychological practice. In addition, the practice of adjusting or controlling for g when evaluating group-level abilities may be misleading, as shown by simulation (McFarland, 2014).
Models with more factors may provide a better fit to sampled data than simpler models due to overfitting. Using simulations, McFarland (2016) illustrated the power of evaluating models differing in complexity by use of cross-validation. The present results found that multiple uncorrelated general factors provided a better fit of cross-validated WAIS-IV scores than a single general factor.
A number of authors have advocated limiting interpretation of the WAIS-IV (Canivez & Watkins, 2010; Gignac & Watkins, 2013) and other cognitive batteries (Beaujean, Parkin & Parker, 2014; Golay & Lecerf, 2011; McGill & Busse, 2015) to full scales scores, based on estimates of variance explained and internal reliability of factors. However the present results question such a conclusion based on the finding that these measures do not necessarily reflect the actual process that generates scores. Any estimate of variance accounted for or factor reliability is model dependent. Indeed, there may be no way of verifying whether a model is actually true (Chatfield, 1995). This is problematic for the common practice of using factor analysis as the primary evidence for construct validity (Thompson & Daniel, 1996). The concern should be on accuracy and the ability of our models to generalize to a wide variety of different circumstances (Foster, 2000). The simplest form of generalization is test-retest reliability. Broader forms of generalization are associated with predicting alternative indices of the construct that our models are intended to represent.
Noncompensatory models of cognitive abilities (Detterman et al., 2016) predict a g dissociable only with elementary cognitive tests (i.e., tests that predominately measure a single process). The present results show that general factors of the WAIS-IV can be dissociated statistically. This provides support for the general concept of compensatory process overlap theory (Kovacs & Conway, 2016). Process overlap theory holds that multiple factors determine performance on a given test. Noncompensatory models (Detterman et al., 2016) conceptualize test performance as involving a linear chain of processes with the weakest link in this chain being the limiting factor in test performance. It is possible that the statistical dissociation of general factors reflects the fact that there are multiple strategies that can provide solutions to any given test. Even so, the use of elementary cognitive tests, if such exist, may be useful for clarifying the nature of client deficits.
Abilities theorists such as Kranzer and Jensen (1992), Detterman et. al. (2016), and Kovacs and Conway (2016) have advocated conceptualization of g as a composite of multiple abilities. This view of g as a formative construct (i.e., a composite of several factors) differs from the view that g is a unitary construct (Carroll. 1991). This distinction is relevant clinically, as noted by Markus and Borsboom (2013), since the issue of item sampling becomes more important with formative constructs. With reflective constructs (i.e., causal latent variables) it is only necessary to sample from a few representative indices of the trait in question. In contrast, formative constructs require a broader representation of the domain in question. As a unitary construct, g might be associated with some global aspect of brain function, such as myelination (Miller, 1994) or plasticity (Garlick, 2002). Alternatively, cognitive test performance might be determined by multiple partially overlapping abilities (Kovacs and Conway, 2016) associated perhaps with dynamically interacting networks. Thus different conceptualizations of g view it as a statistical artifact, a composite of many distinct abilities, or a monolithic determinant of a large portion of the covariance in tests of mental abilities.
That the different subscales of the WAIS-IV involve multiple distinct abilities was shown explicitly for visual puzzles by Fallows & Hilsabeck (2012) who found that WAIS-IV visual puzzles correlated with several neuropsychological measures. They concluded that performance on visual puzzles was influenced by memory, mental flexibility, processing speed, and language abilities. These same abilities are likely to influence performance on other WAIS-IV subscales. For example, the similarities subscale is modeled as reflecting verbal comprehension (Wechsler, 2008) or crystalized intelligence (Benson et al., 2010). However it also requires flexibility in that examinees must select alternative concepts for different items. Likewise figure weights and matrix reasoning require flexibility in shifting between different concepts. Indeed, all of the WAIS-IV subscales require some degree of sustained attention, understanding and retaining instructions, and speeded processing. One way to better characterize possible subcomponents of these general factors would be to systematically vary distinct characteristics of the tests. For example, using this approach with fMRI, Hampshire, Thompson, Duncan & Owen (2011) found that distinct networks were differentially responsive to rule complexity and analogical demands.
Concerns about the interpretation of the results of factor analysis are by no means new. For example, Eysenck (1952) cautioned against viewing the results of factor analysis as absolute. Rather he suggested that factor analysis might provide hypotheses that require further testing. Likewise, Overall (1964) provided several examples demonstrating problems with applying simple structure given that scores were generated by more complex models. Both Eysenck (1952) and Overall (1964) viewed factor analysis as a useful tool provided that researchers understood the limitations of this method. As the present results show, these concerns should also include the results of structural modeling.
It is a misconception to assume that factor analysis or structural equation modeling can reveal the structure of human abilities. The factors these methods produce associate tests that are correlated. The correlation between any pair of tests could be due to a single common process or many distinct shared processes. As a result, factor analysis reflects the structure of test batteries rather than the structure of human abilities and is highly dependent on the selection of tests that are included in the analysis (McFarland, 2014). Accordingly inferences from the results of factor analysis and structural modeling should be primarily about the structure of test batteries rather than the structure of human mental abilities. Researchers and clinicians should consider multiple sources of evidence to evaluate hypothesis about the processes generating test results.
Footnotes
Disclosure statement: The author reports no conflicts of interest.
References
- Anderson JC, Gerbing DW. Structural equation modeling in practice: a review and recommended two-step approach. Psychological Bulletin. 1988;103:411–423. [Google Scholar]
- Anderson M. Cortex forum on the concept of general intelligence in neuropsychology. Cortex. 2005;41:99–100. doi: 10.1016/s0010-9452(08)70883-9. [DOI] [PubMed] [Google Scholar]
- Arlot S, Celisse A. A survey of cross-validation procedures for model selection. Statistics Surveys. 2010;4:40–79. [Google Scholar]
- Beaujean AA, Parkin J, Parker S. Comparing Cattell-Horn-Carroll factor models: Differences between bifactor and higher order models in predicting language achievement. Psychological Assessment. 2014;26:789–805. doi: 10.1037/a0036745. [DOI] [PubMed] [Google Scholar]
- Benson N, Hulac DM, Kranzler JH. Independent examination of the Wechsler adult intelligence scale- fourth addition (WAIS-IV): What does the WAIS-IV measure? Psychological Assessment. 2010;22:121–130. doi: 10.1037/a0017767. [DOI] [PubMed] [Google Scholar]
- Borsboom D, Mellenbenbergh GJ, van Heerden J. The theoretical status of latent variables. Psychological Review. 2003;110:203–219. doi: 10.1037/0033-295X.110.2.203. [DOI] [PubMed] [Google Scholar]
- Brown MW. Cross-validation methods. Journal of Mathematical Psychology. 2000;44:108–132. doi: 10.1006/jmps.1999.1279. [DOI] [PubMed] [Google Scholar]
- Browne MW, Cudeck R. Alternative ways of assessing model fit. In: Bollen KA, Long JS, editors. Testing Structural Equation Model. Newbury Park: Sage; 1993. pp. 136–162. [Google Scholar]
- Campbell DT, Fiske DW. Convergent and discriminant validation by multitraJt-multimethod matrix. Psychological Bulletin. 1959;56:81–105. [PubMed] [Google Scholar]
- Canivez GL, Watkins MW. Investigation of the factor structure of the Wechsler Adult Intelligence Scale- fourth edition (WAIS-IV): Exploratory and higher order factor analysis. Psychological Assessment. 2010;22:827–836. doi: 10.1037/a0020429. [DOI] [PubMed] [Google Scholar]
- Carroll JB. No demonstration that g is not unitary, but there’s more to the story: Comment on Kranzler and Jensen. Intelligence. 1991;15:423–436. [Google Scholar]
- Carroll JB. Human cognitive abilities: A survey of factor-analytic studies. New York, NY: Cambridge University Press; 1993. [Google Scholar]
- Chatfield C. Model uncertainty, data mining and statistical inference. Journal of the Royal Statistical Society, Series A. 1995;158:419–466. [Google Scholar]
- Cudneck R, Henly SJ. Model selection in covariance structures analysis and the “problem” of sample size: a clarification. Psychological Bulletin. 1991;109:512–519. doi: 10.1037/0033-2909.109.3.512. [DOI] [PubMed] [Google Scholar]
- Detterman DK, Petersen E, Frey MC. Process overlap and system theory: a simulation of, comment on, and integration of Kovacs and Conway. Psychological Inquiry. 2016;27:200–204. [Google Scholar]
- Eysenck HJ. Uses and abuses of factor analysis. Journal of the Royal Statistical Society, Series C. 1952;1:45–49. [Google Scholar]
- Fallows RR, Hilsabeck RC. WAIS-IV visual puzzles in a mixed clinical sample. The Clinical Neuropsychologist. 2012;26:942–050. doi: 10.1080/13854046.2012.697193. [DOI] [PubMed] [Google Scholar]
- Foster MR. Key concepts in model selection: performance and generalizability. Journal of Mathematical Psychology. 2000;44:205–231. doi: 10.1006/jmps.1999.1284. [DOI] [PubMed] [Google Scholar]
- Franzen MD. Reliability and Validity in Neuropsychological Assessment. Plenum Press; New York: 1989. [Google Scholar]
- Gardner H. Frames of mind: The theory of multiple intelligences. New York, NY: Basic Books; 1983. [Google Scholar]
- Garlick D. Understanding the nature of the general factor of intelligence: the role of individual differences in neural plasticity as an explanatory mechanism. Psychological Review. 2002;109:116–136. doi: 10.1037/0033-295x.109.1.116. [DOI] [PubMed] [Google Scholar]
- Gignac GE. Higher-order models versus direct hierarchical models: g as superordinate or breath factor? Psychology Science Quarterly. 2008;50:21–43. [Google Scholar]
- Gignac GE, Watkins MW. Bifactor modeling and the estimation of model-based reliability in the WAIS-IV. Multivariate Behavioral Research. 2013;48:639–662. doi: 10.1080/00273171.2013.804398. [DOI] [PubMed] [Google Scholar]
- Golay P, Lecerf T. Orthogonal higher order structure and confirmatory factor analysis of the French Wechsler Adult Intelligence Scale (WAIS-III) Psychological Assessment. 2011;23:143–152. doi: 10.1037/a0021230. [DOI] [PubMed] [Google Scholar]
- Guilford JP. The structure of intellect. Psychological Bulletin. 1956;53:267–293. doi: 10.1037/h0040755. [DOI] [PubMed] [Google Scholar]
- Hampshire A, Thompson R, Duncan J, Owen AM. Lateral prefrontal cortex subregions make dissociable contributions during fluid reasoning. Cerebral Cortex. 2011;21:1–10. doi: 10.1093/cercor/bhq085. [DOI] [PMC free article] [PubMed] [Google Scholar]
- Kaplan E. The process approach to neuropsychological assessment. Aphasiology. 1988;2:309–312. doi: 10.1176/jnp.2.1.72. [DOI] [PubMed] [Google Scholar]
- Kovacs K, Conway ARA. Process overlap theory: a unified account of the general factor of intelligence. Psychological Inquiry. 2016;27:151–177. [Google Scholar]
- Kranzer JH, Jensen AR. Unitary g: Unquestioned postulate or empirical fact? Intelligence. 1991;15:437–448. [Google Scholar]
- MacCallum RC, Roznowski M, Necowitz LB. Model modifications in covariance structure analysis: the problem of capitalization on chance. Psychological Bulletin. 1992;111:490–504. doi: 10.1037/0033-2909.111.3.490. [DOI] [PubMed] [Google Scholar]
- Markus KA, Borsboom D. Reflective measurement models, behavior domains, and common causes. New Ideas Psychology. 2013;31:54–64. [Google Scholar]
- McFarland A single g factor is not necessary to simulate positive correlations between cognitive tests. Journal of Clinical and Experimental Neuropsychology. 2012;34:378–384. doi: 10.1080/13803395.2011.645018. [DOI] [PubMed] [Google Scholar]
- McFarland DJ. Modeling individual subtests of the WAIS IV with multiple latent factors. PLOS One. 2013;8:e74980. doi: 10.1371/journal.pone.0074980. [DOI] [PMC free article] [PubMed] [Google Scholar]
- McFarland DJ. Simulating the effects of common and specific abilities on test performance: An evaluation of factor analysis. Journal of Speech, Language, and Hearing Research. 2014;57:1919–1928. doi: 10.1044/2014_JSLHR-H-13-0166. [DOI] [PubMed] [Google Scholar]
- McFarland DJ. Modeling general and specific abilities: Evaluation of bifactor models for the WJ-III. Assessment. 2016;23:698–706. doi: 10.1177/1073191115595070. [DOI] [PubMed] [Google Scholar]
- McFarland DJ. How neuroscience can inform the study of individual differences in cognitive abilities. Reviews in the Neurosciences. doi: 10.1515/revneuro-2016-0073. (in press) [DOI] [PMC free article] [PubMed] [Google Scholar]
- McGill RJ, Busse RT. Incremental validity of the WJ III COG: Limited predictive effects beyond the GIA-E. School Psychology Quarterly. 2015;30:353–365. doi: 10.1037/spq0000094. [DOI] [PubMed] [Google Scholar]
- Milberg WP, Hebben NAQ, Kaplan E. The Boston process approach to neuropsychological assessment. In: Grant I, Adams KM, editors. Neuropsychological Assessment and Neuropsychiatric Disorders. 3rd. New York: Oxford University Press; 2009. pp. 42–65. [Google Scholar]
- Miller EM. Intelligence and brain myelination: a hypothesis. Personality and Individual Differences. 1994;17:803–832. [Google Scholar]
- Mosier CI. The need and means of cross-validation. I. Problems and designs of cross-validation. Educational and Psychological Measurement. 1951;11:5–11. [Google Scholar]
- Murray AL, Johnson W. The limitations of model fit in comparing the bi-factor versus higher-order models of human cognitive ability structure. Intelligence. 2013;41:407–422. [Google Scholar]
- Overall JE. Note on the scientific status of factors. Psychological Bulletin. 1964;61:270–276. doi: 10.1037/h0046664. [DOI] [PubMed] [Google Scholar]
- Reeve CL, Charles JE. Survey of opinions on the primacy of g and social consequences of ability testing: A comparison of expert and non-expert views. Intelligence. 2008;36:681–688. [Google Scholar]
- Reise SP. The rediscovery of bifactor measurement models. Multivariate Behavioral Research. 2012;47:667–696. doi: 10.1080/00273171.2012.715555. [DOI] [PMC free article] [PubMed] [Google Scholar]
- Reise SP, Moore TM, Haviland MG. Bifactor models and rotations: exploring the extent to which multidimensional data yield univocal scale scores. Journal of Personality Assessment. 2010;92:544–559. doi: 10.1080/00223891.2010.496477. [DOI] [PMC free article] [PubMed] [Google Scholar]
- Reynolds MR, Floyd RG, Niileksela CR. How well is psychometric g indexed by popular global composites? Evidence from three popular intelligence tests. Psychological Assessment. 2013;25:1314–1321. doi: 10.1037/a0034102. [DOI] [PubMed] [Google Scholar]
- Rodriguez A, Reise SP, Haviland MG. Evaluating bifactor models: calculating and interpreting statistical indices. Psychological Methods. 2016;21:137–150. doi: 10.1037/met0000045. [DOI] [PubMed] [Google Scholar]
- SAS. SAS/STAT 9.22 User’s Guide. SAS Institute Inc; Cary NC: 2010. [Google Scholar]
- Spearman C. General intelligence objectively determined and measured. American Journal of Psychology. 1904;15:201–293. [Google Scholar]
- Thompson B, Daniel LG. Factor analytic evidence for the construct validity of scores: a historic overview and some guidelines. Educational and Psychological Measurement. 1966;56:197–208. [Google Scholar]
- Valerius S, Sparfeldt JR. Consistent g- as well as consistent verbal-, numerical- and figural-factors in nested models? Confirmatory factor analysis using three test batteries. Intelligence. 2014;44:120–133. [Google Scholar]
- Warrington EK, James M, Maciejewski C. The WAIS as a lateralizing and localizing diagnostic instrument: a study of 656 patients with unilateral cerebral lesions. Neuropsychologia. 1986;24:233–239. doi: 10.1016/0028-3932(86)90055-2. [DOI] [PubMed] [Google Scholar]
- Wechsler D. Wechsler Adult Intelligence Scale- Fourth Edition: Technical and interpretive manual. San Antonio, TX: Pearson; 2008. [Google Scholar]