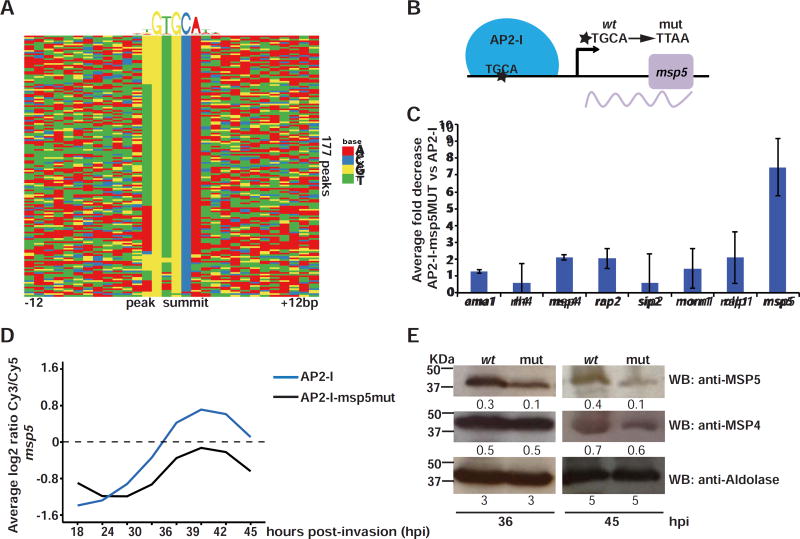
Figure 3. PfAP2-I binding to the TGCA DNA motif is important for transcription.
A- DNA motif heatmap of the trimmed ChIP-seq peaks +/−12bp surrounding the highest scoring motif (as discovered by DREME, figure S3B) shows that the GTGCA DNA motif is found within the majority of the peaks. Each row represents a peak summit and each column represents an individual nucleotide (See also figures S3B-C and S4). B- The mutations introduced to generate PfAP2-I-GFP::msp5MUT parasites (see also figures S3D-E). C- ChIP-qPCR showing that PfAP2-I binding to msp5 in PfAP2-I-GFP::msp5MUT parasites is decreased more than 7-fold versus PfAP2-I-GFP parasites. The data are represented as mean ± SD and n=3 (see figure S3F for original fold values). D- Microarray data using RNA extracted from PfAP2-I-GFP and PfAP2-I-GFP::msp5MUT parasites at eight time points beginning at 18hpi (see figure S3G) shows that when the TGCA motif is mutated upstream of msp5, levels of the msp5 transcript are reduced (see also figures S3H-I). The plot shows the average of two biological replicates (See Table S3 for complete microarray results). E- Western blot using specific antibodies against MSP5 show that the MSP5 protein level is decreased in PfAP2-I-GFP::msp5MUT (mut) versus PfAP2-I-GFP (wt) parasites but MSP4 and aldolase protein levels are unchanged at 36 and 45hpi. Densitometry values are shown below each blot.

