
Figure 6. Model for Assembly of the LSU.
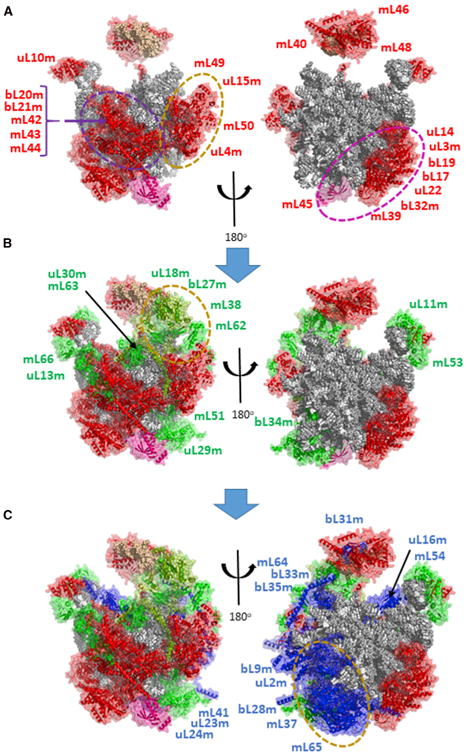
16S rRNA and tRNAV are shown with spheres representing individual residues in gray or tan, respectively. Proteins are shown as cartoon structures within transparent surfaces. Major clusters of coordinately assembled interacting proteins are surrounded by dashed ovals and illustrated in Figures S6 and S7.
(A) Early MRPs are shown in red, but with mL45 shown in magenta to provide a marker
(B) Intermediate proteins are shown in green, but uL18m and mL63 are colored pea green, since they exhibit earlier binding kinetics than other intermediate proteins.
(C) Late-binding proteins are shown in blue.