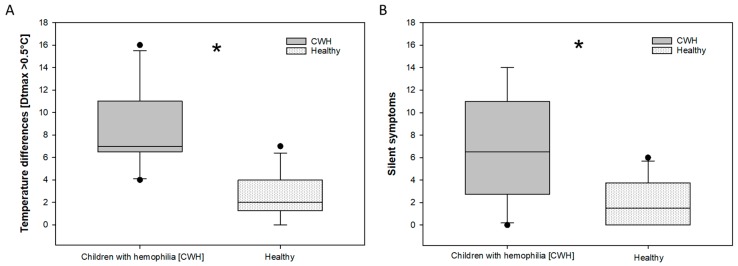
Figure 2.
Thermographic side differences (>0.5 °C) (A) and corresponding silent symptoms/tender points (B) found in the groups of hemophilic and healthy children. Significant differences in temperature differences (A) were assessed by a student’s t-test. Significant differences in the amount of silent symptoms (B) were analyzed using the Mann-Whitney Rank Sum Test. Asterisks marks indicate significant differences with a p = <0.05.

