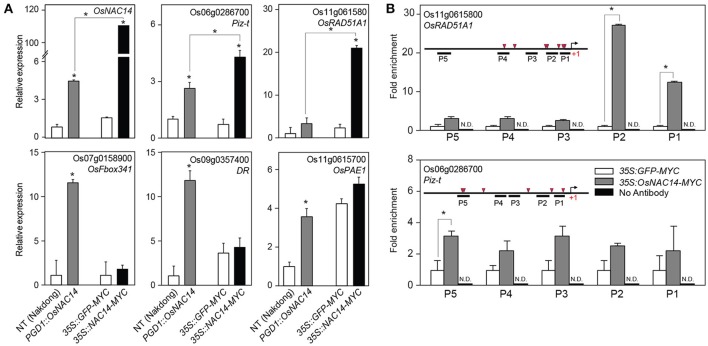
Figure 6.
Identification of direct target gene of OsNAC14. (A) The expression pattern of the candidate target genes of OsNAC14 in rice protoplasts. Rice protoplasts were isolated from 2-week-old NT and PGD1::OsNAC14 (OsNAC14OX) plants (left two bars in each panel). The protoplasts isolated from NT plants were further transfected by plasmids harboring 35S::GFP or 35S::OsNAC14 (right two bars in each panel). Total RNA was extracted from isolated protoplasts and applied for qRT-PCR analysis. OsUbi1 was used as internal control for normalization. Data represent mean value + standard deviation (SD) (n = 3). Significant differences from NT or between samples are indicated by asterisks (one-tailed Student's t-test, *P < 0.05). (B) Chromatin Immunoprecipitation (ChIP)-PCR analysis. Chromatins in rice protoplasts were precipitated using anti-MYC antibody and applied for qRT-PCR analysis. The structure of promoter and positions of tested region by qRT-PCR are illustrated in graph (left top). Red triangles represent distribution of NAC binding motif in the promoter regions. Rice protoplasts transfected with 35S::GFP-MYC were used as negative control for 35S::OsNAC14-MYC. ChIP experiment performed without anti-MYC antibody were applied as negative control for anti-MYC antibody. 1% input was used as control for normalization. Data represent mean value + standard deviation (SD) (n = 3). N.D., not detected. The information of primers used for ChIP-PCR was listed in Supplemental Table S2. Significant differences are indicated by asterisks (one-tailed Student's t-test, *P < 0.05).

