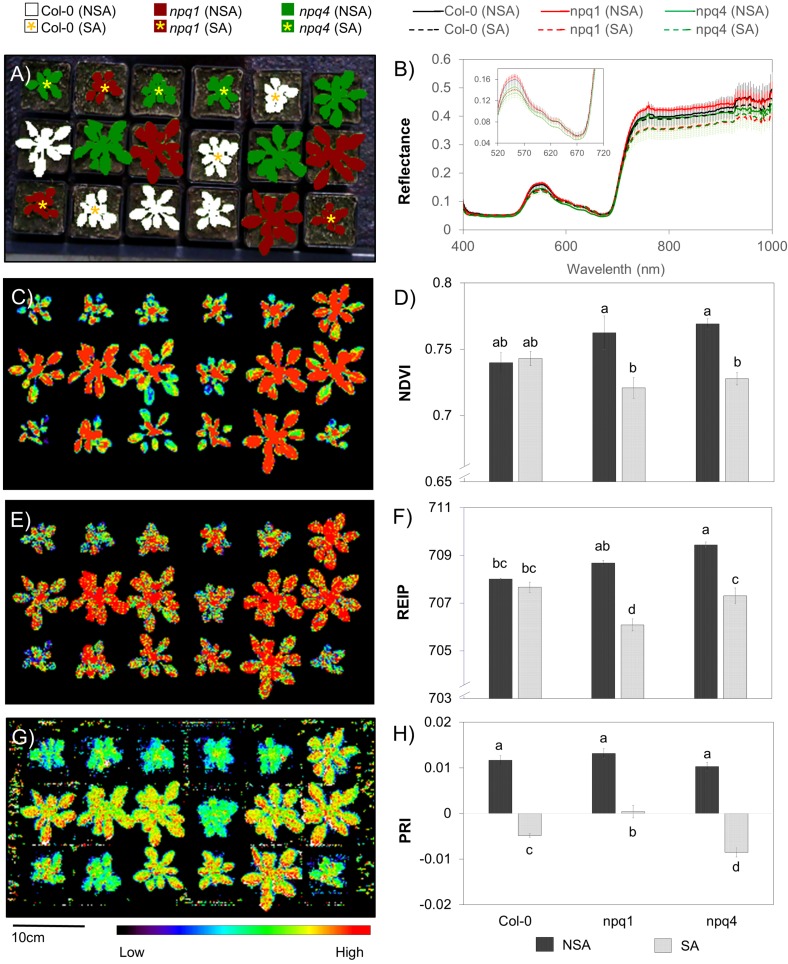
Figure 6.
Differences observed between non-stress acclimated (NSA) and stress acclimated (SA) Arabidopsis wildtype (Col-0) and NPQ-deficient mutants (npq1 and npq4) as shown by computed spectral ratios. Left panel shows the false-colour images of selected ROIs (A); NDVI (C); REIP (E); and PRI (G) computed from spectral information captured by the Specim IQ camera. Right panel shows the computed means ± standard errors of reflectance values (B); NDVI (D); REIP (F); and PRI (H) from three individual plants randomly distributed in the imaging frame. Different letters indicate significant differences based on LSD ().

