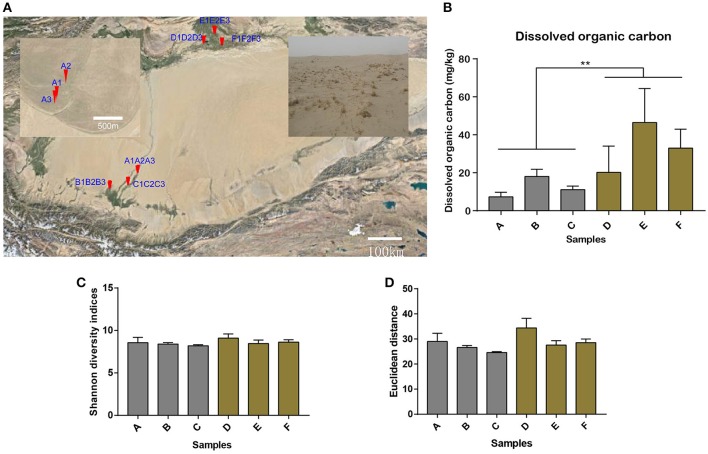
Figure 1.
Soil sampling sites in the Tarim Basin. (A) The soil samples (n = 18) were collected from different oases of the Hotan Prefecture in the south of the Tarim Basin (samples A1–A3, B1–B3, and C1–C3) and from Xayar County in the north of the Tarim Basin (samples D1–D3, E1–E3, and F1–F3). The A sites are shown in the enlarged window. Details of the sample collection sites can be found in Table S1. Soil samples were collected from depths of 10–20, 20–30, and 30–40 cm for each sample. Bar plot showing (B) the dissolved organic carbon content (**Indicates significant difference) and (C) the alpha diversity by Shannon diversity indices for all the 18 samples, as well as (D) the consistent beta diversity by Euclidean distance for the three samples in one location for the six sample groups.

