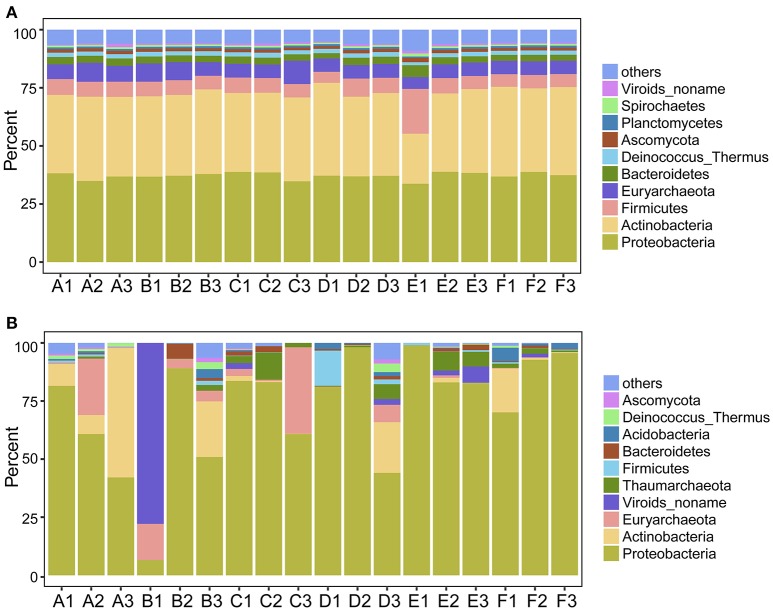
Figure 3.
Proportion of the most abundant phylum-level OTUs determined by metagenomic (A) and metatranscriptomic (B) analysis. Soil samples were collected from the Tarim Basin, from different locations and depths, and associated genomic DNA and transcriptomes were subjected to analysis based on deep sequencing and phylogenetic analysis.

