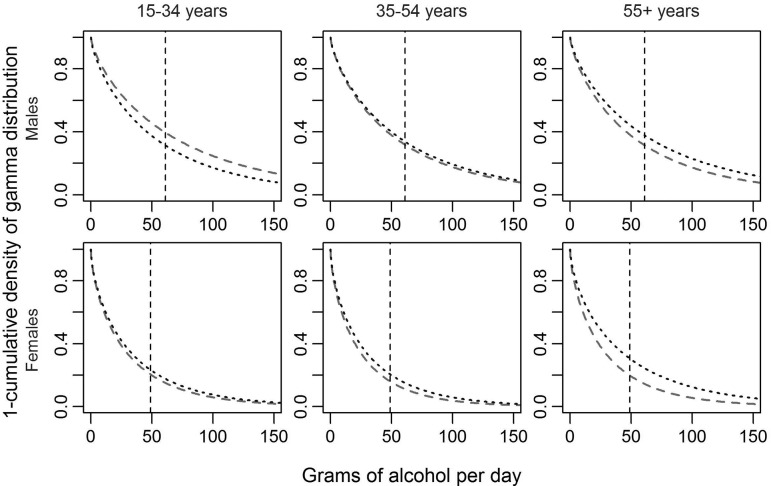
Figure 4.
One minus the cumulative density of the gamma distribution of alcohol use for high (dashed) and low SES (dotted) and by age and sex in the adult (15+) South African general population in 2012. The graph indicates the proportion of current drinkers (y-axis) with an average level of drinking of alcohol use equal to or above the grams of pure alcohol per day indicated on the x-axis.

