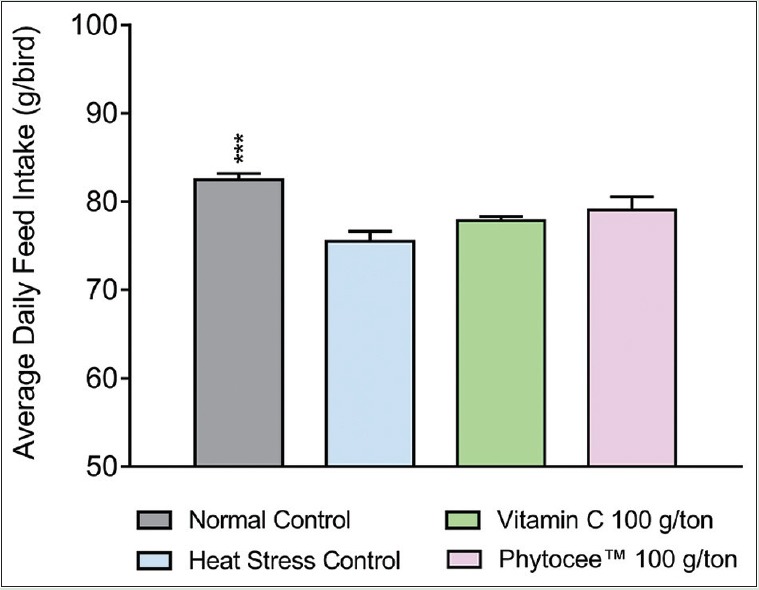
Figure 1.

Effect of Phytocee™ on average daily feed intake values is expressed as mean ± standard error of the mean; n = 6 ***P < 0.001 as compared to heat stress control based on one-way analysis of variance followed by Dunnett's multiple comparison test using SPSS
